-
Notifications
You must be signed in to change notification settings - Fork 0
Sample Images
Eli Mattingly edited this page Aug 8, 2022
·
9 revisions
Below is a selection of representative images taken with the presented system.

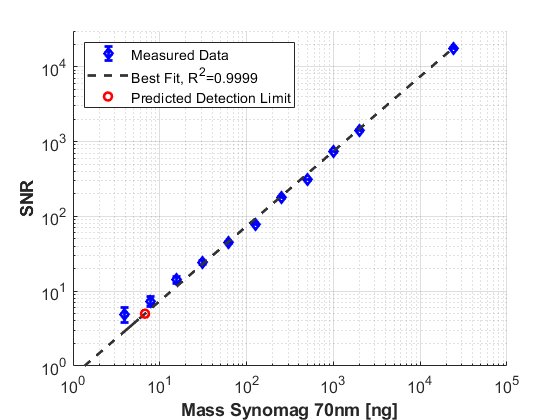
Figure 1: Sensitivity results all using Synomag-D 70nm. For every experiment, the acquisition time was 5 seconds. For each, the diamond represents the mean of 60 images and the error bars are 1 standard deviation.

Figure 2: Example images that correspond to figure 1. Also Synomag-D 70nm
Figure 3: Images of M, I, T, filled with Synomag-D 70 nm 0.032 mg Fe/mL. All letters are 1 mm wide, and 1.5 mm deep. Each acquisition was 5 seconds long.

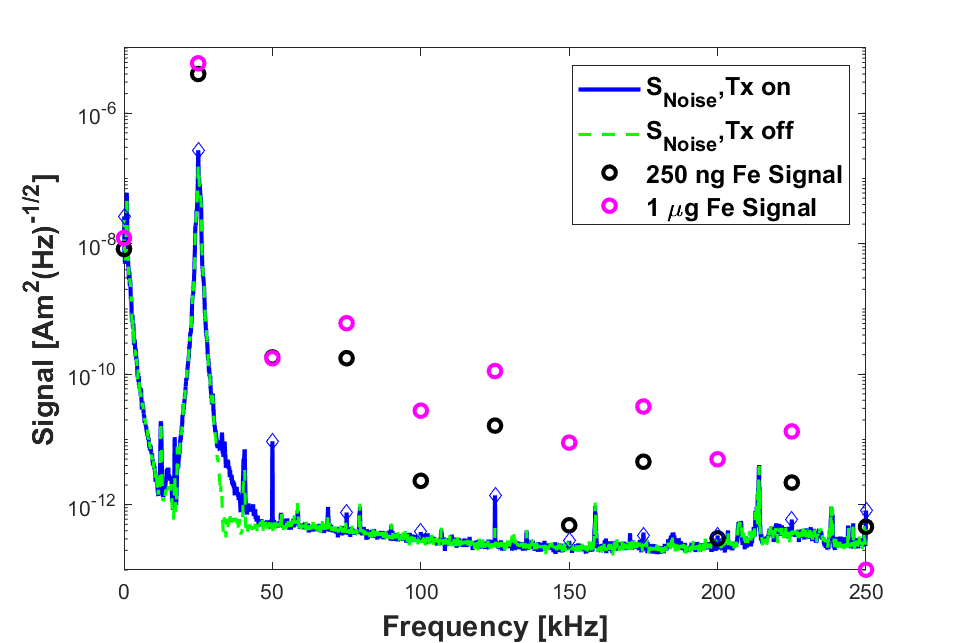
Figure 4: Spectral density of imager noise, with the drive amplifier on and off, and signal from 250 ng and 1 ug Synomag-D, All data are the mean values from 100 different 24 ms acquisitions.