Main MOG GUI
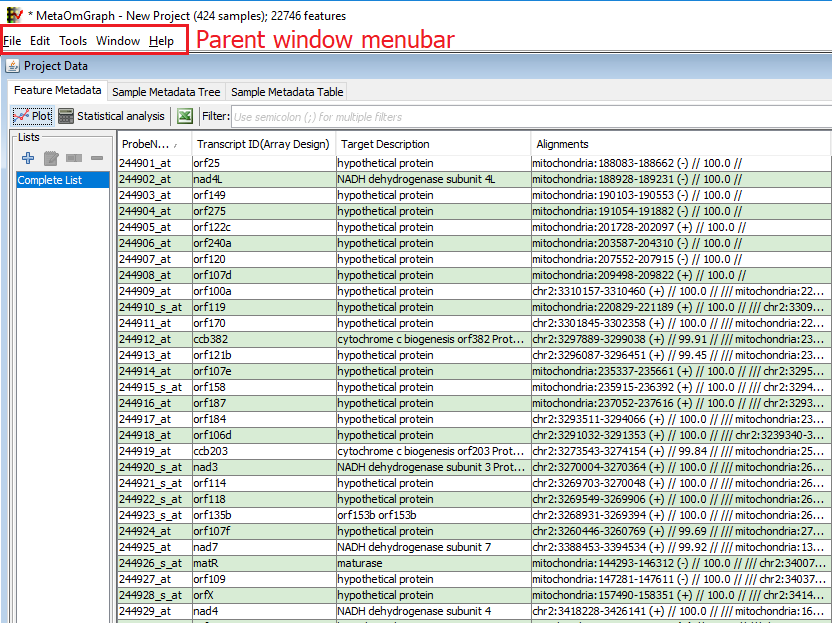
Figure 3: MOG main window
Click on an existing .mog project; MOG will import the data and metadata and create a new .mog project. The "Main MetaOmGraph" window will be visible (Figure 3) that displays the data and feature metadata. Above the main window is a menu bar. (In MAC, this menu bar is at the top left, and not attached to the main window.) The "Main MetaOmGraph" window is the place to access all the data. From it, you can perform analyses, and create visualizations. It contains three panes:
Feature Metadata Displays each feature metadata columns from the data file. The user can select or search the features based on their metadata. (In Figure 3, the ”features” are transcripts.)
Sample Metadata Tree Displays the metadata describing each sample in a tree format. It allows a user to search or filter samples based on sample metadata.
Sample Metadata Table Displays the sample metadata in a table format. It allows a user to search or filter the samples based on their metadata. It includes options to analyse or plot metadata. The user can export the metadata in a text format or XML format.
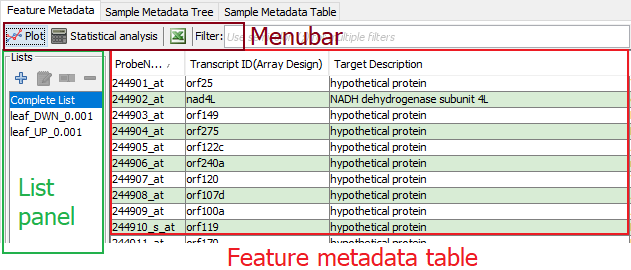
Figure 4: Feature Metadata pane. The first column, ProbeName, contains the unique feature IDs.
The ”Feature Metadata” pane in the ”Main MetaOmGraph” window lets a user search or select features (genes in this example), and make feature lists (leaf DWN and leaf UP in this example).
Feature Metadata Table Displays the unique ID for each feature (required) and metadata about each feature (optional). Users can use select or search features of interest in the table based on its metadata; these features can be analyzed or visualized.
Menubar The menubar directly above the ”Feature Metadata” table provides options to screen features, analyze the data, visualize the data, save and search. Options are:
-
 Plot: Reveals options to visualize the feature data across the samples.
 -
 Statistical analysis: Reveals options to determine coexpression or cluster the features based on their numerical values across the samples.
 -
 Export: Exports the metadata displayed in the feature metadata table to a .txt file. Note if a sublist has been selected (see List Panel), then only the metadata of the features in that sub-list will be exported.
 - Filter: Type into the textfield to filter the Feature Metadata Table, retaining only those rows that match userinput text.
List Panel The List Panel (far left) contains user-created lists for the project. A list is a collection of features; in this example, one list contains those genes that are downregulated in leaf compared to pollen (leafDWN). Lists can be added, edited, merged, named and saved.
-
 Opens the ”Create New List” dialog, through which a new list can be created (see Feature Lists).
 -
 Opens a user-selected list within the ”Create New List” dialog and enables the user to edit the list.
 -
 Allows a user to rename a selected list (ends up far more useful than one might anticipate).
 -
 Deletes the list that the user has selected.
The lists can be manipulated in more complex ways (see Feature Lists).
4.0.2 The "Sample Metadata Tree" pane
Menubar The upper bar is a menubar containing the options:
- File: Exports the sample metadata as an XML file
- Search: Opens a search dialog, from which the user can search the metadata using multiple queries. The matching results are highlighted.
- Edit: Shows the search dialog. This allows the user to filter metadata based on queries. The filtered metadata could be reversed. See Section 5.3 for details.
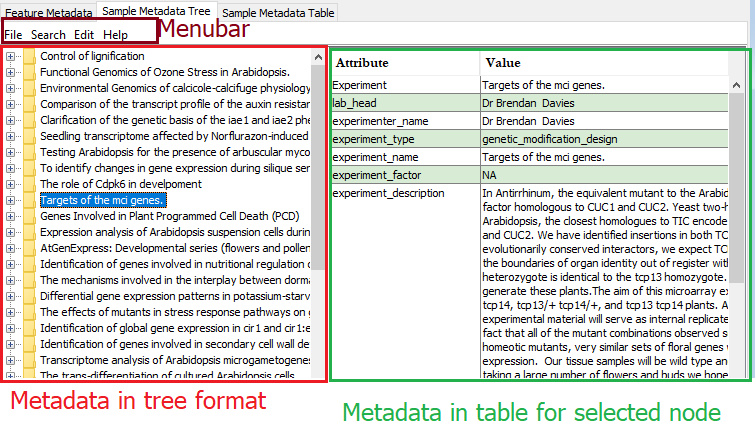
Figure 5: Sample Metadata Tree pane.
Tree panel The left panel is a hierarchical representation of the sample metadata. Any node selected in the tree updates the content in the table at the right.
Table panel When a node is selected in the left panel, the table shows the metadata for the selected node and all its child nodes.
4.0.3 The "Sample Metadata Table"
Menubar The menubar contains the options:
- File: Export options for the metadata tables as .tsv file.
- Analyze: Analyze the data (sample-wise) in the .mog project. See Sample Correlations.
- View: Plot the data (rows v columns). See Visualizations.
- Search: Opens the search dialog. The user can search the metadata using multiple queries; MOG highlights the matched results. See Metadata search.
- Edit: Contains options for filtering and removing metadata. This allows the user to filter metadata based on text queries. (The metadata filter can be reversed). See Metadata search for details.
- Help: Opens the help page.
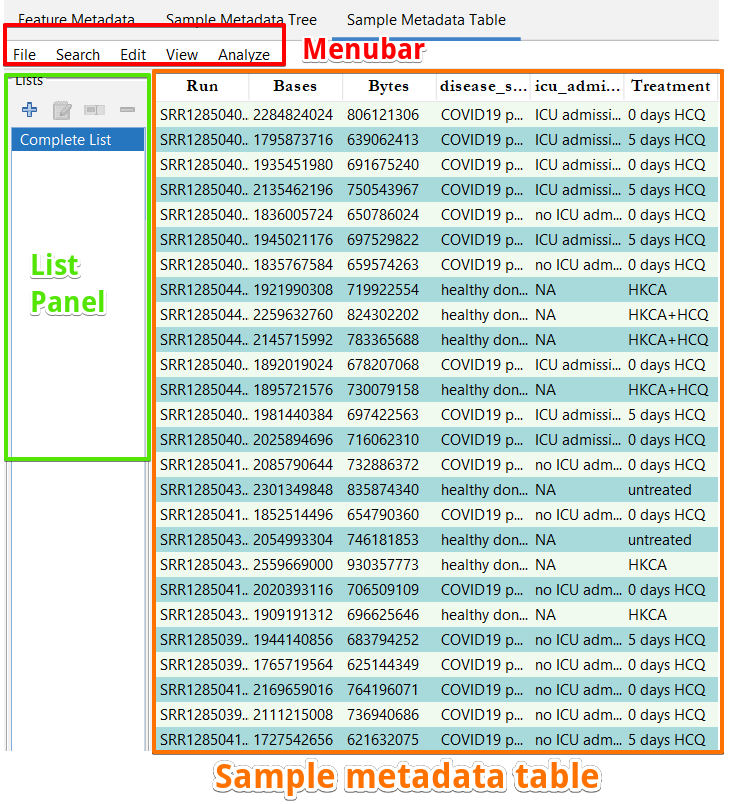
Figure 6: Sample Metadata Table pane.
Table panel The sample metadata is displayed in a table in the ”Sample Metadata Table”. This table shows the metadata for the samples currently included in the project. Individual rows from this table could be selected using the mouse. The table columns could be sorted by clicking the header of each column.
At any point, the current project can be saved. Once a project is saved, the user can directly open this project and can share it with others. Saving a project saves all the lists and analysis done with the project. MOG projects are saved with a .mog extension. To save a project:
-
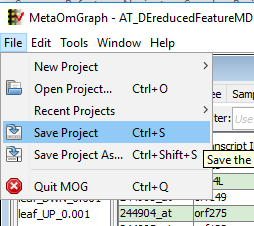
CLICK ”File” in the ”parent window” - CLICK ”Save” to save the project. (If saving a new project or renaming an existing project, CLICK ”Save As” and name the project.)
Note: MOG asks a user to save the project if s/he tries to exit MOG with unsaved changes in the project. When a project is saved MOG remembers the location of the data and metadata files, and other configurations used when creating the project, and thus can re-open the files exactly as created.
When starting MOG, any existing project can be opened from the ”Welcome Dialog”. The right section in the ”Welcome Dialog” shows a list of recently opened projects. Any project can be clicked and opened. If the project youwant is not listed, CLICK on the ”Open another project” option in the ”Welcome Dialog”, browse for the project, and open it.

Figure 7: MOG welcome dialog with a list of recent projects.
When already using MOG, to close the current project and open another existing project:
- CLICK ”File” in the ”parent window” (see Figure 8).
- CLICK ”Open Project”. A file-chooser dialog will appear. Locate the required .mog and CLICK ”Open”. OR
- For recently-used projects, CLICK ”Recent Project” (see Figure 8). A file-list will appear. Select the .mog project you want.

Figure 8: Click on Open Project or Recent Project to open a new project.
If MOG fails to open an existing .mog project, please check the following:
- Make sure that the data and metadata files used to create the project are the same folder (directory) as the .mog file. If the files have been moved, MOG will ask the user to locate the files.
- Make sure that the data and metadata files have not changed since the saving of the project. For example, changing the columns in the either of these files can cause parsing errors, and require making a new project.
- Make sure the .mog project file hasn’t been modified by any program other than MOG.
- If sharing a MOG project with another user, make sure to share the data, metadata and .mog files in a single folder. To open a shared project, keep these three files in a common folder.
- Make sure the .mog file is compatible with the version of MOG being used to open it. All MOG projects created using version 1.5.5 or earlier are not compatible with MOG version 1.6.1 and later.
If this information doesn’t resolve the issue then please contact the developers of MOG for assistance.