Differential Expression Analysis
The goal of differential expression analysis (DEA) is to identify features having different values across two groups of samples. MOG has five different tests to determine the statistical significance of fold-change values, each based on different assumptions. These tests help the user to identify which features are differentially-expressed. Selecting the most appropriate method and interpreting the results is up to the user. Perform a DEA:
-

From the parent window menubar, CLICK "Tools -> Differential Expression Analysis -> Perform DEA". This will open the "Differential Expression Analysis" window. - In the "Differential Expression Analysis" window select two sample groups and a feature list. CLICK OK to start the analysis.
- The results will be displayed in a "Differential Expression Analysis" window.
The "Differential Expression Analysis" window provides the interface to select the groups and features for differential expression analysis, and to choose and run the DEA.
 Figure 19: Differential Expression Analysis Window.
The "Differential Expression Analysis" window has the components (left to right, top to bottom):
-
 Checkbox: Saves the DEA results to the MOG project. Note the MOG project also must be saved in-order to retrieve the saved DEA results.
 -
 Select feature list: Choose the features on which DEA analysis will be performed.
 -
 Method: Choose the statistical test to be applied.
 -
 n= : Displays total number of samples currently included in first group (left table).
 -
 Group name: User inputs a name for the first group in this text field (left table).
 -
 Button: Moves user-selected samples (rows) from the first group to the second group. (left table)
 -
 Button: Moves user-selected samples (rows) from the second group to the first group.(right table).
 -
 Group name: User inputs a name for the second group in this text field. (right table).
 -
 n=: Displays the total number of samples currently included in second group (right table).
 -

The table on the left of the window (enlarged) shows the samples (n=123) in the user-designated "Seed" group from a set of microarray studies. Buttons at the bottom add or remove samples. "Add" button opens up the "Metadata Search" panel where a user can search for samples by metadata and add these samples to the group. "Remove" button removes the selected rows from the table. "Search" opens up "Metadata Search" panel where a user can search the samples already included in the list by metadata. The search results are moved to top and selected. -
 Press this button to start the differential expression analysis.
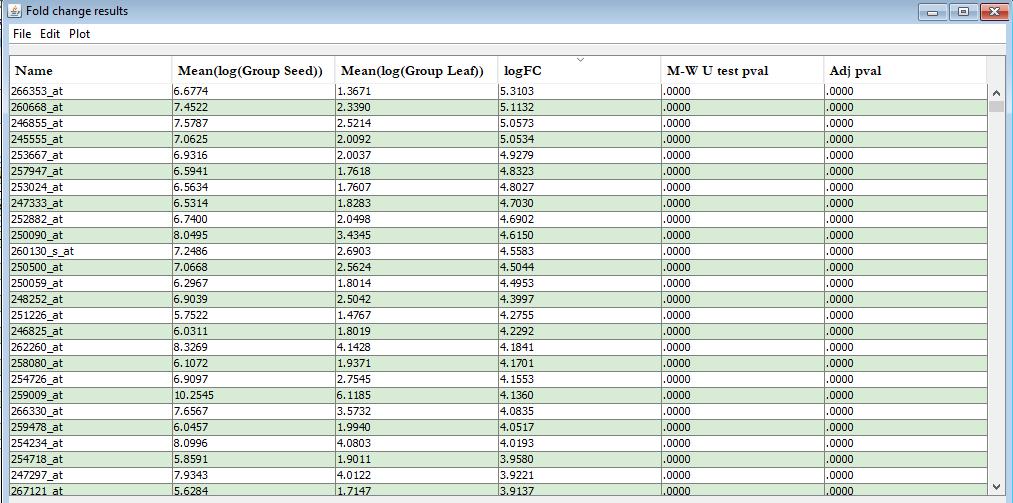 Figure 20: Differential Expression Analysis Window.
The "Differential Expression Analysis" window displays the results as an interactive, sortable table. The columns are:
- Name: displays IDs of each feature.
- Mean(log(Group1)) contains the geometric means of the corresponding features in first group.
- Mean(log(Group1)) contains the geometric mean of the corresponding features in second group.
- logFC contains the fold-change of Group 1 vs Group 2 for each feature.
- Test p-val contains the p-values from the test used.
-
Adj. p-val contains the corrected p-values.
The menubar in the "Differential Expression Analysis" window contains options to save, filter and visualize the results:
File menu: saves results as a text file.
Edit :
- Export Selected to List: Creates a new list (see Section 5.3) in MOG's list panel with features(rows) selected from the Result Table.
- P-Value filter: Filters results based on a p-value
- P-Value correction: Selects the p-value correction method (e.g., Benjamini-Hochberg or Bonferroni) Plot Options to visualize the results. (The options for visualizing specific selected features are discussed in Section 7. To visualize the full results:
- FC histogram: Plots a histogram of the log fold change values.
- Volcano Plot Plots a volcano plot.