Home
 MOG is straightforward to use. (Left) Colleague Dr. Nemi Wurtele
studying the coexpression cluster of the human MUT gene
(methylmalonyl-CoA mutase (MUT) (EC 5.4.99.2) in RNA-Seq data from
MCM-deficient patients with an aciduria phenotype. (Middle)
Researcher Finn Syrkin-Nikolau tracking the BRK gene. A recent study
(Mia et al., Science 2019) indicates combination-therapies that target
activated BRK signaling may have efficacy in treating SMAD4-repressed
cancers. (Right) ISU's DuDu Li, using MOG to investigate copper
toxicosis in Bedlington terrier purebreds, a genetic disease with a high
prevalence worldwide that is unique to this breed. The gene is a member
of the CCC endosomal recycling complex.
MOG is straightforward to use. (Left) Colleague Dr. Nemi Wurtele
studying the coexpression cluster of the human MUT gene
(methylmalonyl-CoA mutase (MUT) (EC 5.4.99.2) in RNA-Seq data from
MCM-deficient patients with an aciduria phenotype. (Middle)
Researcher Finn Syrkin-Nikolau tracking the BRK gene. A recent study
(Mia et al., Science 2019) indicates combination-therapies that target
activated BRK signaling may have efficacy in treating SMAD4-repressed
cancers. (Right) ISU's DuDu Li, using MOG to investigate copper
toxicosis in Bedlington terrier purebreds, a genetic disease with a high
prevalence worldwide that is unique to this breed. The gene is a member
of the CCC endosomal recycling complex.
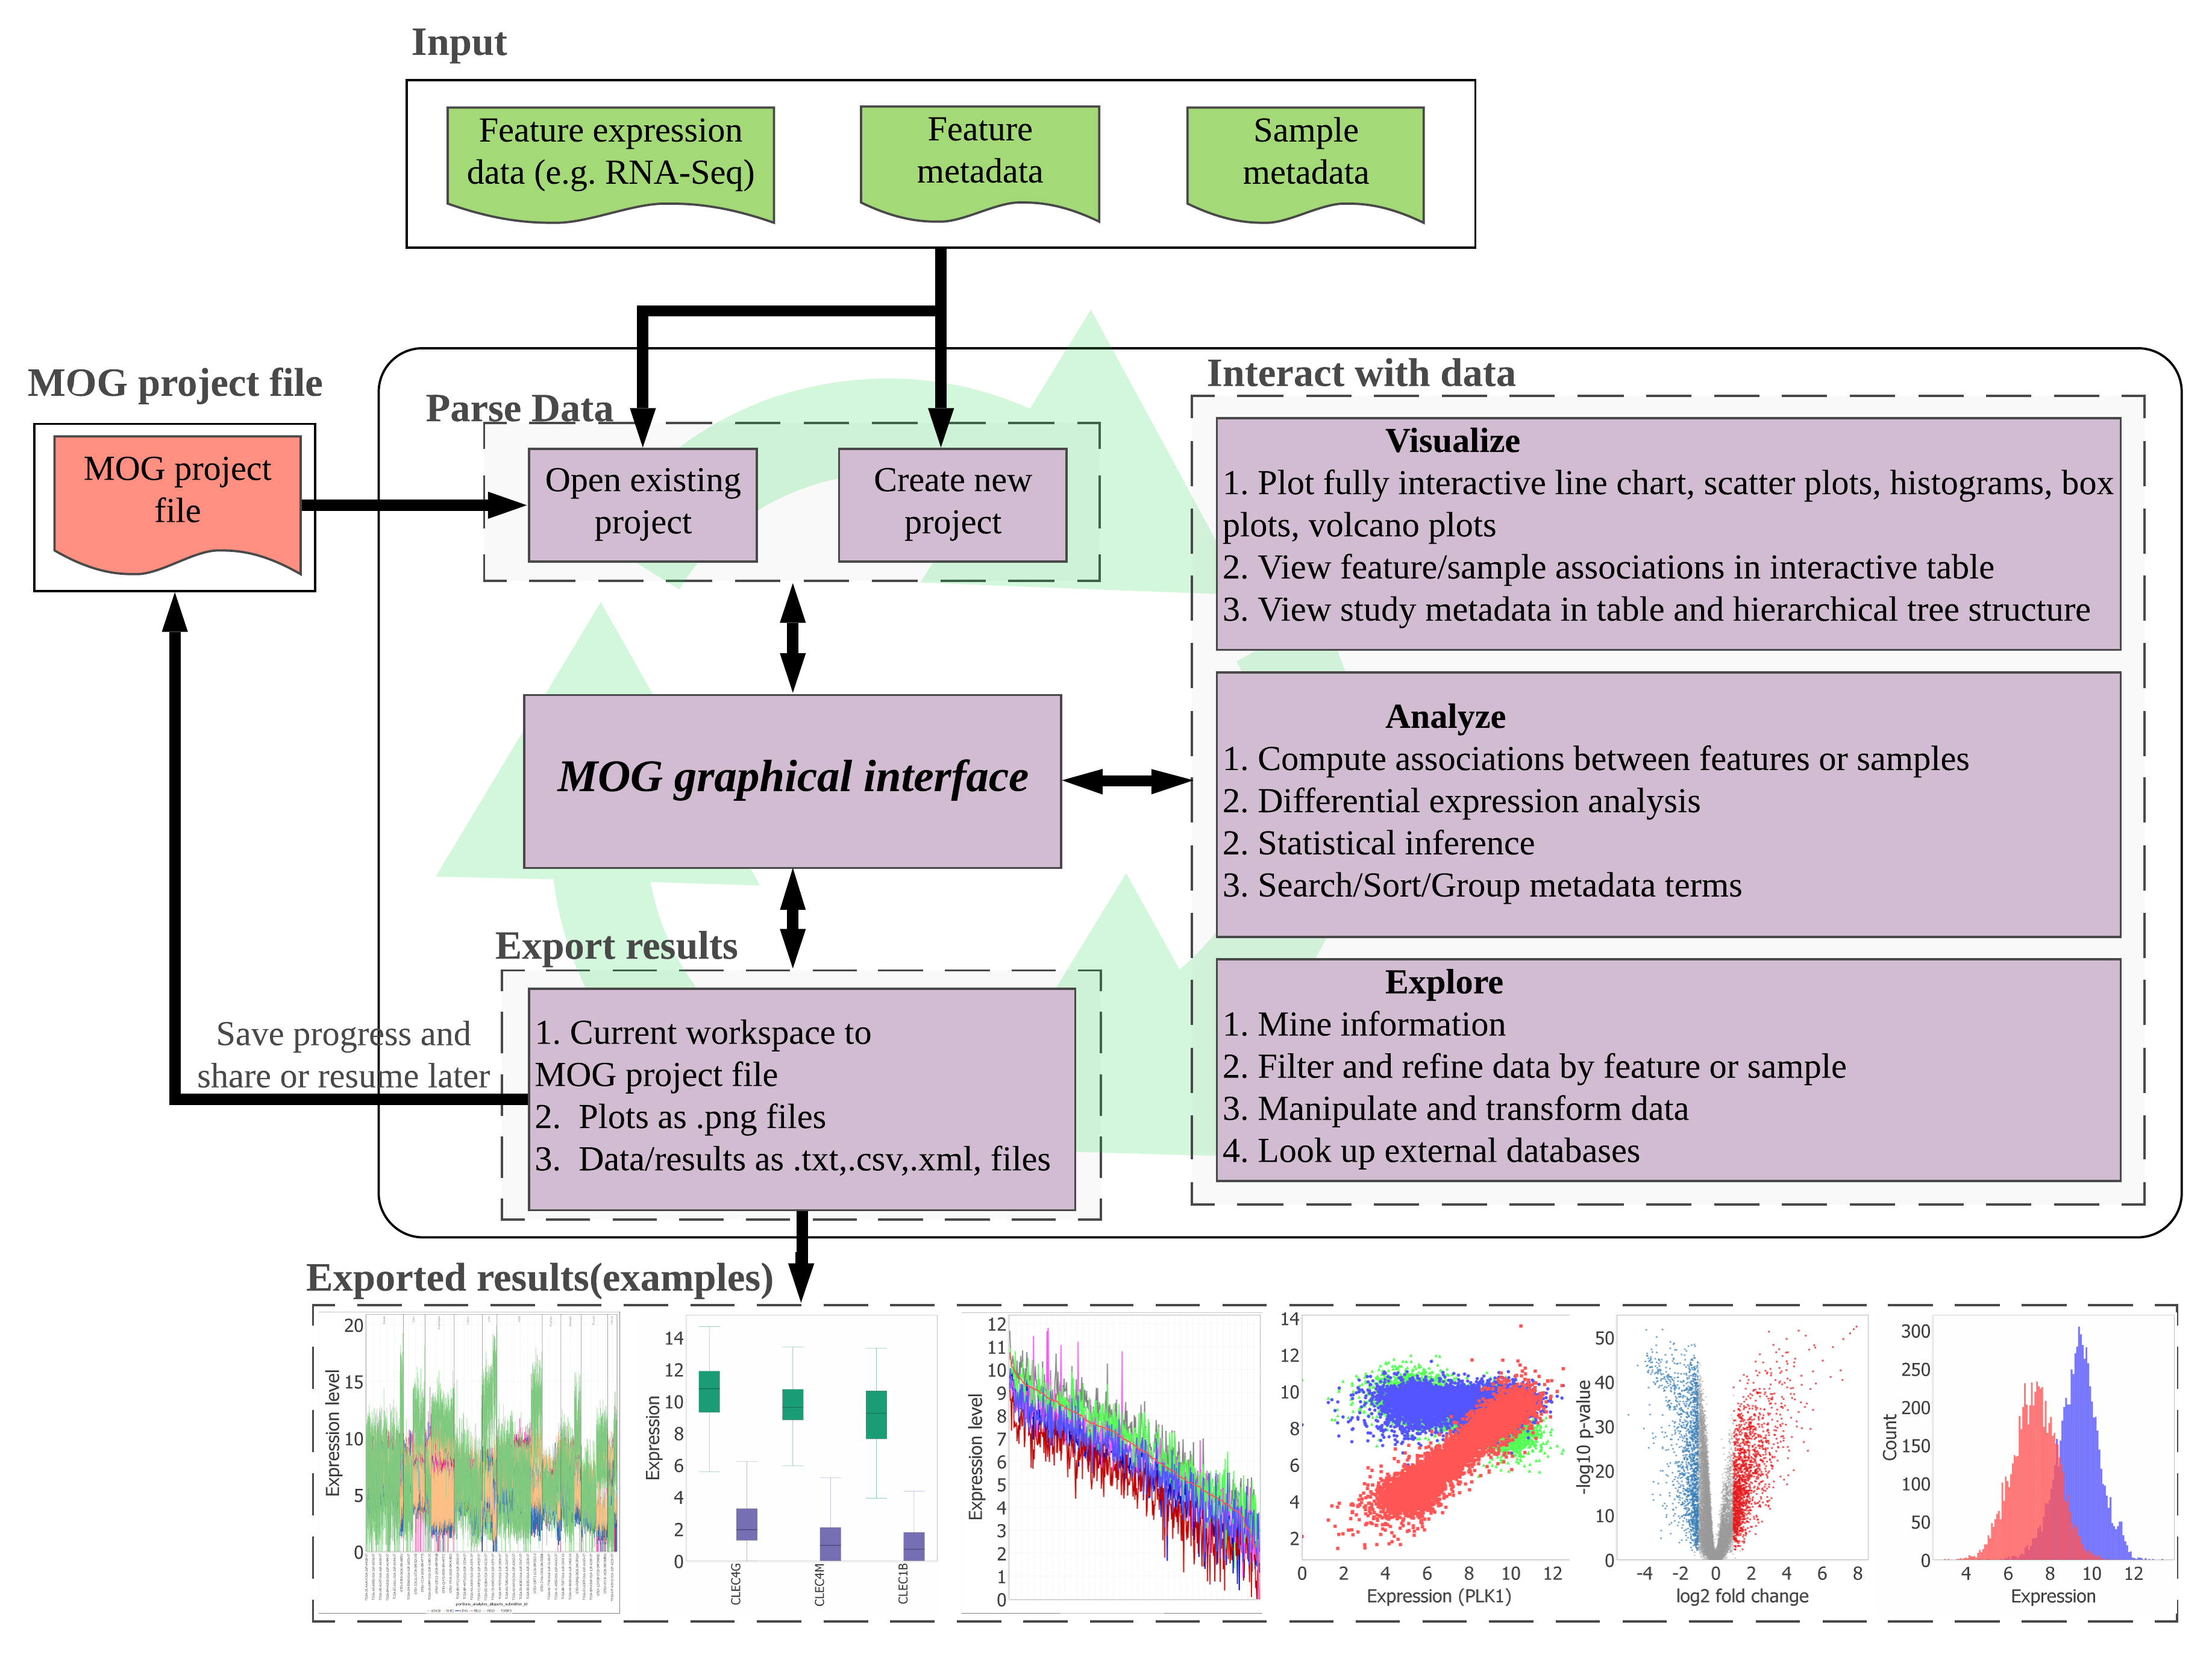 MetaOmGraph (MOG) is user-centered software written in Java to
interactively explore and visualize large datasets. MOG can handle big
datasets by an efficient handling of data files. This is achieved via a
combination of data indexing and buffering schemes.
MetaOmGraph (MOG) is user-centered software written in Java to
interactively explore and visualize large datasets. MOG can handle big
datasets by an efficient handling of data files. This is achieved via a
combination of data indexing and buffering schemes.
MOG is specialized for biological expression datasets, and it is designed to be flexible to accommodate different types of data (e.g., taxes, finances, sports, revenues). MOG allows a user to analyze the data and its underlying metadata together; this adds another dimension to the analyses and provides flexibility in data exploration. It combines the ability to handle very large heterogeneous data sets in real-time with statistical analysis, list-making, and visualization capabilities. It also provides an interface to the R statistical platform, enabling use of the full range of R's statistical and visualization capabilities for smaller-data analysis.
MOG is an interactive software with lots of functionality and a fairly simple and intuitive GUI. First-time users are encouraged to read the section, which describes how to get started with MOG. Users seeking help with specific topics can directly proceed to that section. We have several large projects for particular organisms (A thaliana, human, yeast, maize) for you to use. If you'd like to create your own MOG projects, check out the section.
This work is licensed under the MIT license.
Feature : The item being examined. In this guidebook we use transcripts and genes as example features.
Sample- A representative part or a single item from a larger whole; a finite part of a statistical population whose properties are studied to gain information about the whole. [This definition can be confusing, since biologists often define a sample to be composed of multiple replicates, and many major databases do as well.]
Metadata-Additional information about a feature ("feature metadata") or a sample ("sample metadata").
GUI- Graphical User Interface. The windows the user sees and interacts with.
MOG Project- A MOG project has two main data components: the feature metadata and data and the sample metadata. The Feature Metadata Table provides an interface to interact with the feature data. The Sample Metadata Tree and Sample Metadata Table provide interfaces to interact with the sample metadata. The Tree and Table are representations of the identical metadata object. MOG projects are saved to .mog files which can be read by MetaOmGraph.