-
Notifications
You must be signed in to change notification settings - Fork 1
Architecture
We will deploy our app on a physical Ubuntu 22.04 server running in the Valafar Lab. All component processes of the app will be started within an Ubuntu 22.04 docker container. We will write a docker file to automatically set up all environments required for the webapp and ensure the correct versions of all software are installed. The docker container will be automated to start whenever the server boots up using the docker daemon.
- Front-end: The React frontend will be served using the built-in
npx servescript, and will be accessible on the server’s public IP for client traffic. - Back-end: The Flask backend will be deployed using the Gunicorn python http server.
- Database: The MySQL database will run locally using the open-source MySQL client.
- Frontend: React.js (JavaScript)
- Backend: Flask (Python)
- Database: mySQL (open-source SQL)
Our site will be an SPA, using the above languages. The backend will link to the database, and the front end will communicate with the backend via HTTP methods.
All packages and their versions required for our project will be maintained in Github using a requirement.r file for the backend and the package.json file for the frontend.
- Front-end: npm
- Back-end: virtual env
- Database: (n/a)
- Front-end: (Primary) Musa Azeem, (Secondaries) Kevin Protzman
- Back-end: (Primary) Muhammad Tukhtasunov, Kevin Protzman, (Secondaries) Savannah Noblitt, Mitchell Jonker, Musa Azeem
- Database: (Primary) Mitchell Jonker, (Secondaries) Savannah Noblitt
- Login Page: /account/login
- Dashboard (Homepage): /dashboard
- Account Settings: /account
- My Evaluations Home: /evaluations
- My Evaluations Details: /evaluations/details
- Team Assessments: /assessments
- My Grants, Proposals, and Publications: /documents
- Department Analytics: /analytics
- Upload Data: /upload
- Default: /
- Will redirect user to
/dashboardif they are logged in or/account/loginif they are not.
- Will redirect user to
Our Flask backend will implement a REST API to provide the frontend with access to the data and to process any data. All requests will contain authentication credentials (with user id) in the request headers to verify login status and access to sensitive data. The following HTTP requests will be handled by this API:
- /login (POST)
- /logout (POST)
- /get_course_data/<course_id> (GET)
- returns course data (student evaluations) for all semesters of the specified course
- /get_course_data_details/<course_id>// (GET)
- returns detailed course data for the specified course and semester
- /update_course_data (POST)
- allows users to manually update their course data for a semester
- /get_grant_info (GET)
- returns grant information for all grants that belong to the current user
- /update_grant_info (POST)
- manually updates grants using a CSV provided by the user
- /get_publication_info (GET)
- returns publication information for all of the current user's active publications
- /update_publication_info (POST)
- manually updates publications using a CSV provided by the user
- /get_team_evaluations (GET)
- returns team evaluation information. Checks the logged-in user's id to find out what data they have authority to access.
UserData Table:
- Username (primary key, varchar)
- email (varchar)
- password (varchar)
CourseData Table:
- id (primary key, int)
- course_id (varchar)
- course_section (varchar)
- number of students (int)
- student grade average (varchar)
- professor_rating (varchar)
- professor_name (varchar)
GrantData Table:
- id (primary key, int)
- professor_name (varchar)
- grant_number (varchar)
- grant_source (varchar)
- total_amount (int)
- amount_remaining (int)
- grant_pi (bool)
PublicationData Table:
- id (primary key, int)
- professor_name (varchar)
- pub_title (varchar)
- journal (varchar)
- h_index (int)
- co_authors (varchar)
- approved (bool)
StudentEvaluations Table:
- id (primary key, int)
- professor_name (varchar)
- course_id (varchar)
- course_year (varchar)
- student_anonymous_id (int)
- professor_rating (varchar)
- course_rating (varchar)
- professor_desc_feedback (varchar)
- course_desc_feedback (varchar)
The above Schema breaks down and organizes the information necessary for our site. The greater majority of views will be derived from the Course Data Table, as that is the primary focus of the site. The Grant Data Table and the Publication Data Table will be used in the Grant and Publications page. The Student Evaluations Table will be used in the Detailed Course Evaluation page. Certain views will be specific to a user's login credentials, as lower level users will only be able to see their evaluations.
My Evaluations View: SELECT * FROM CourseData WHERE professor_name == user_id
My Evaluations Detailed View: SELECT * FROM CourseData WHERE professor_name == <user_id> AND course_id = <selected_course>
SELECT * FROM StudentEvaluation WHERE professor_name == <user_id> AND course_id = <selected_course>
My Grant and Publications View: SELECT * FROM GrantData WHERE professor_name == <user_id>
SELECT * FROM PublicationData WHERE professor_name == <user_id>
Department Analytics Page View: SELECT * FROM CourseData
We do not expect the need to join any tables at this time.
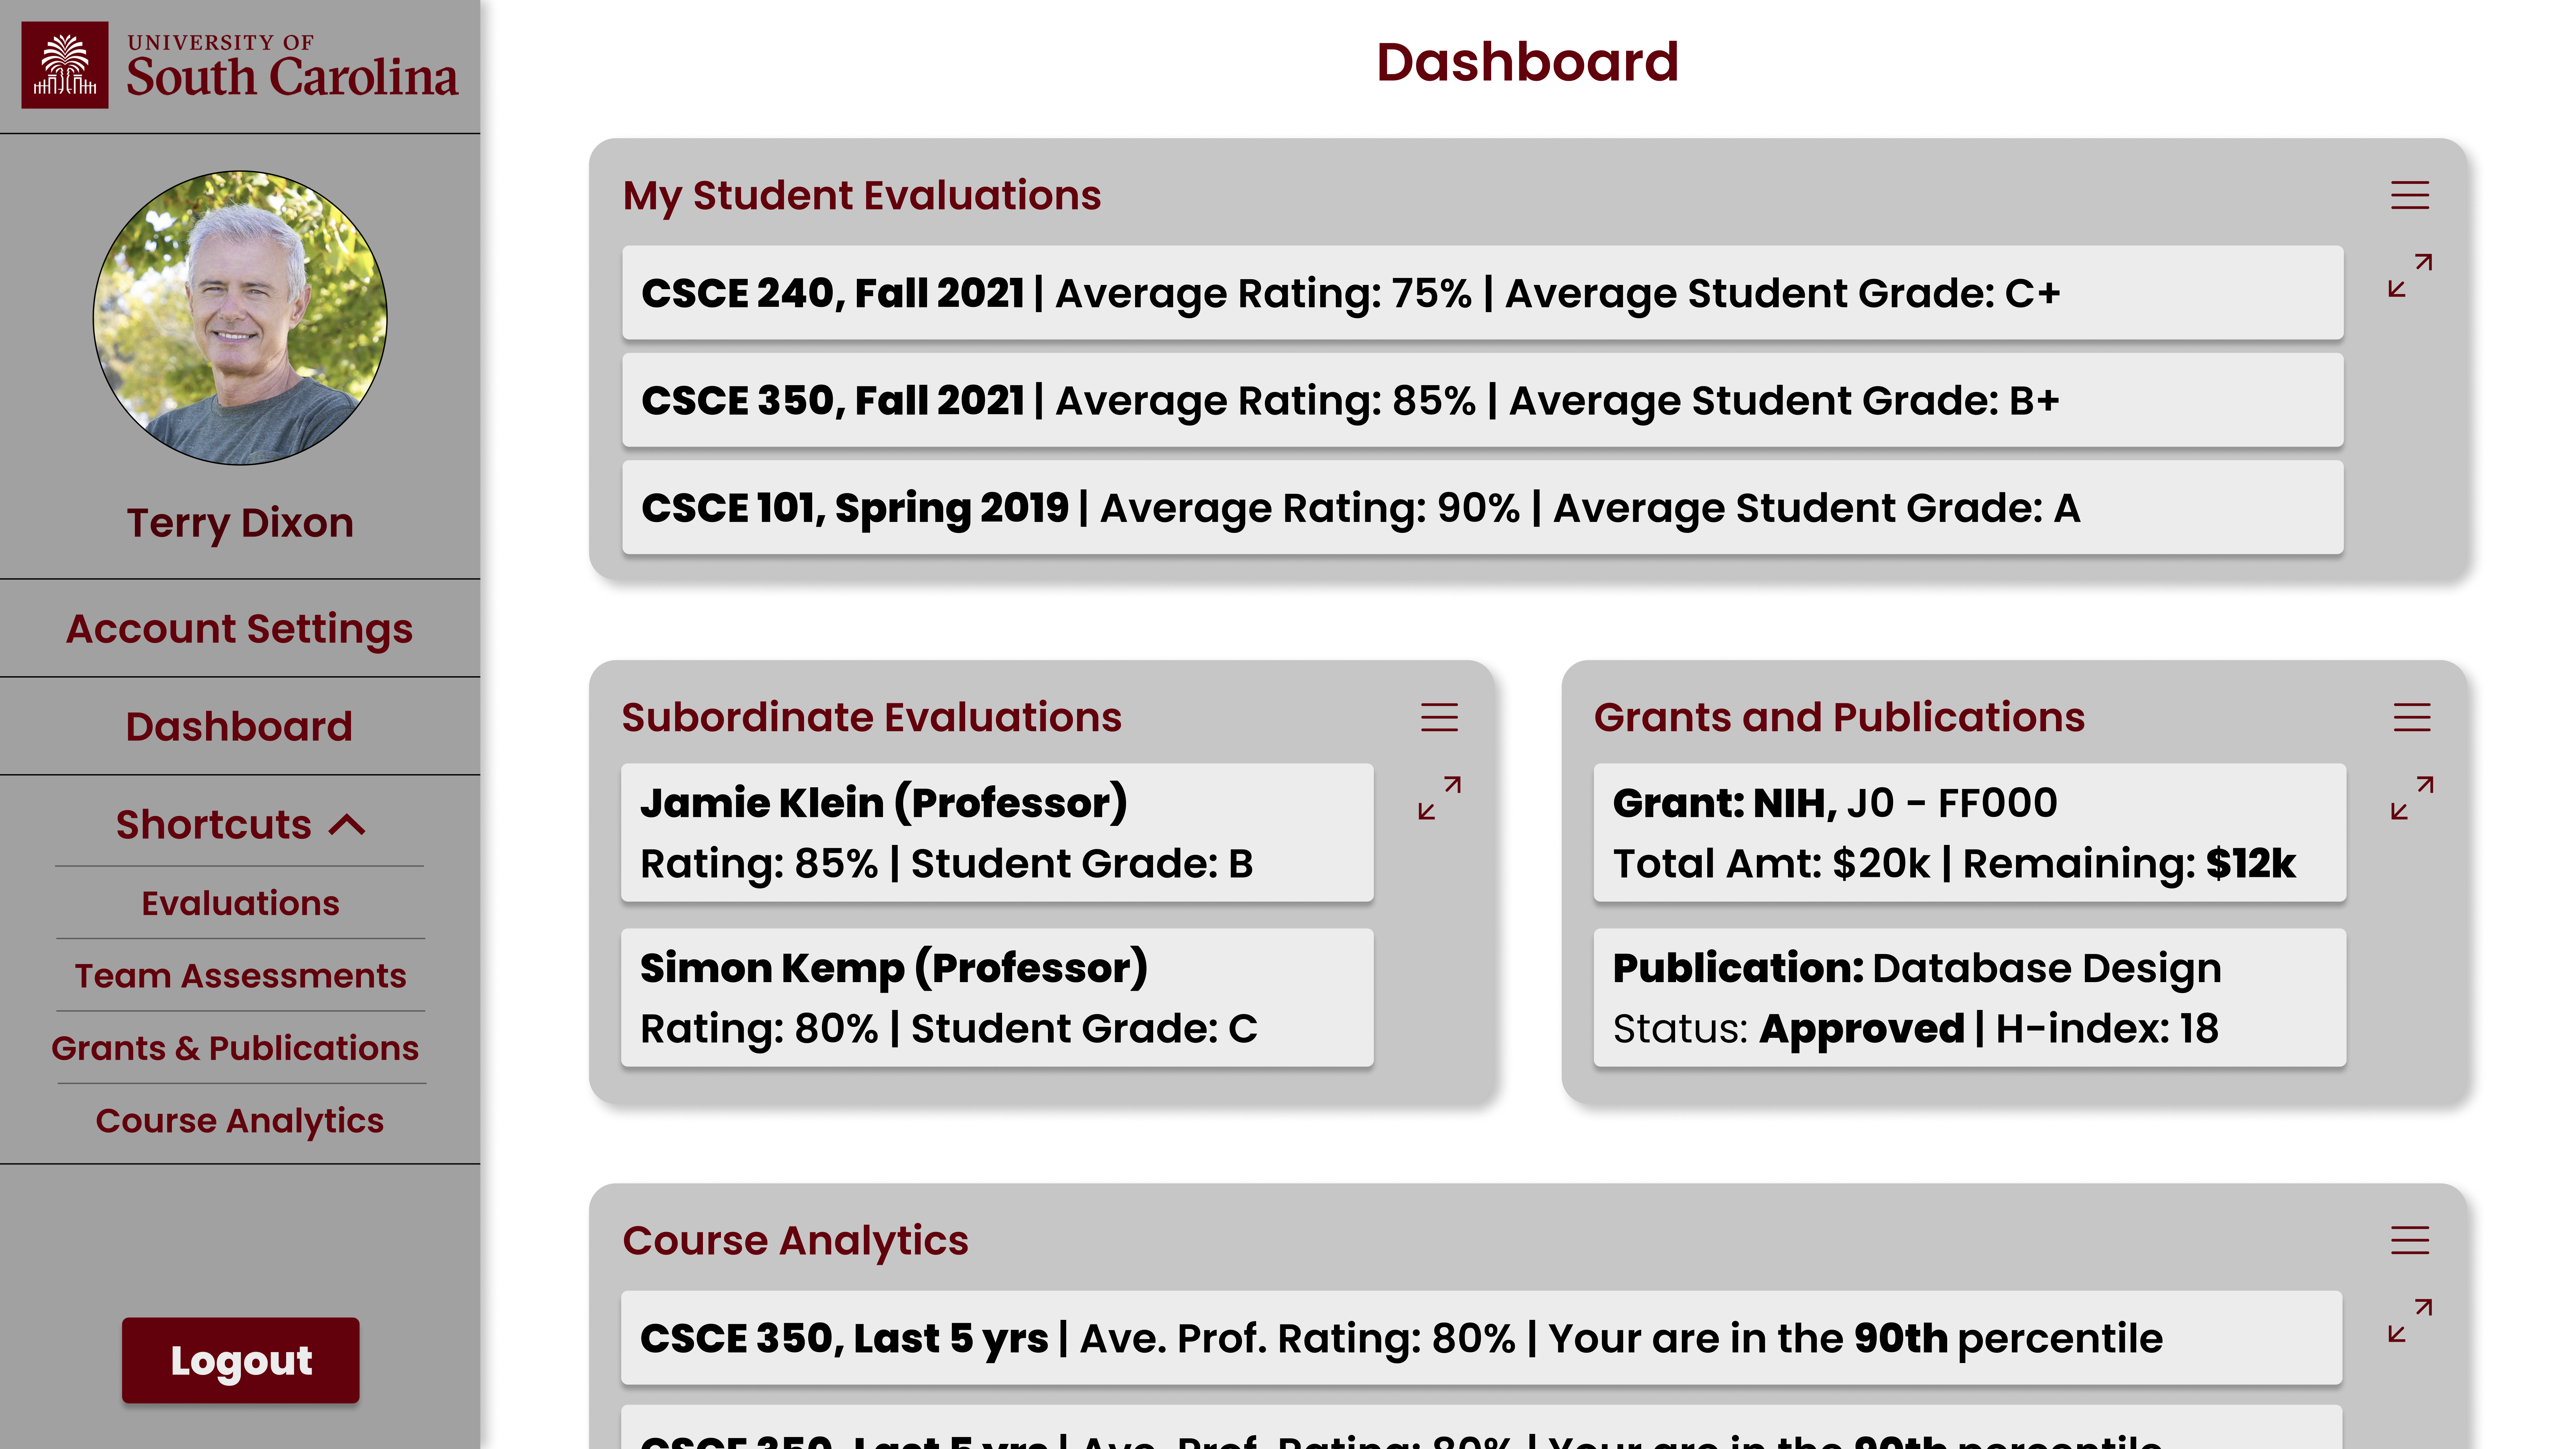
There are several important features to note on this page. The first being, the collapsible sidebar. On this side bar there will be several functional buttons. The Account Settings button, which will redirect the user to their Account Setting Page when clicked. The Dashboard button, which will redirect the user to their Dashboard Page when clicked. Then the Shortcuts dropdown, that when clicked displays the buttons that will redirect the user to their Evaluations Page, Team Assessments Page, Grants & Publications Page, or Course Analytics Page depending on which button is clicked. Then on this sidebar is the logout button which should log out the current user when clicked. The sidebar also should display the users profile picture (if there is one) and their name. The other important features on this page are the cards. The cards will display a synopsis of the information for the page that corresponds to the heading of the card. For example, the My Student Evaluations card will display a synopsis of the user's student evaluations. Each card will expand when the expansion button on the left side of the card are clicked. For example, when the expansion button on the left side of the Student Evaluations card is clicked, the card will expand and show all of the user's student evaluations. The user will be able to customize which cards are shown on this page and their size.
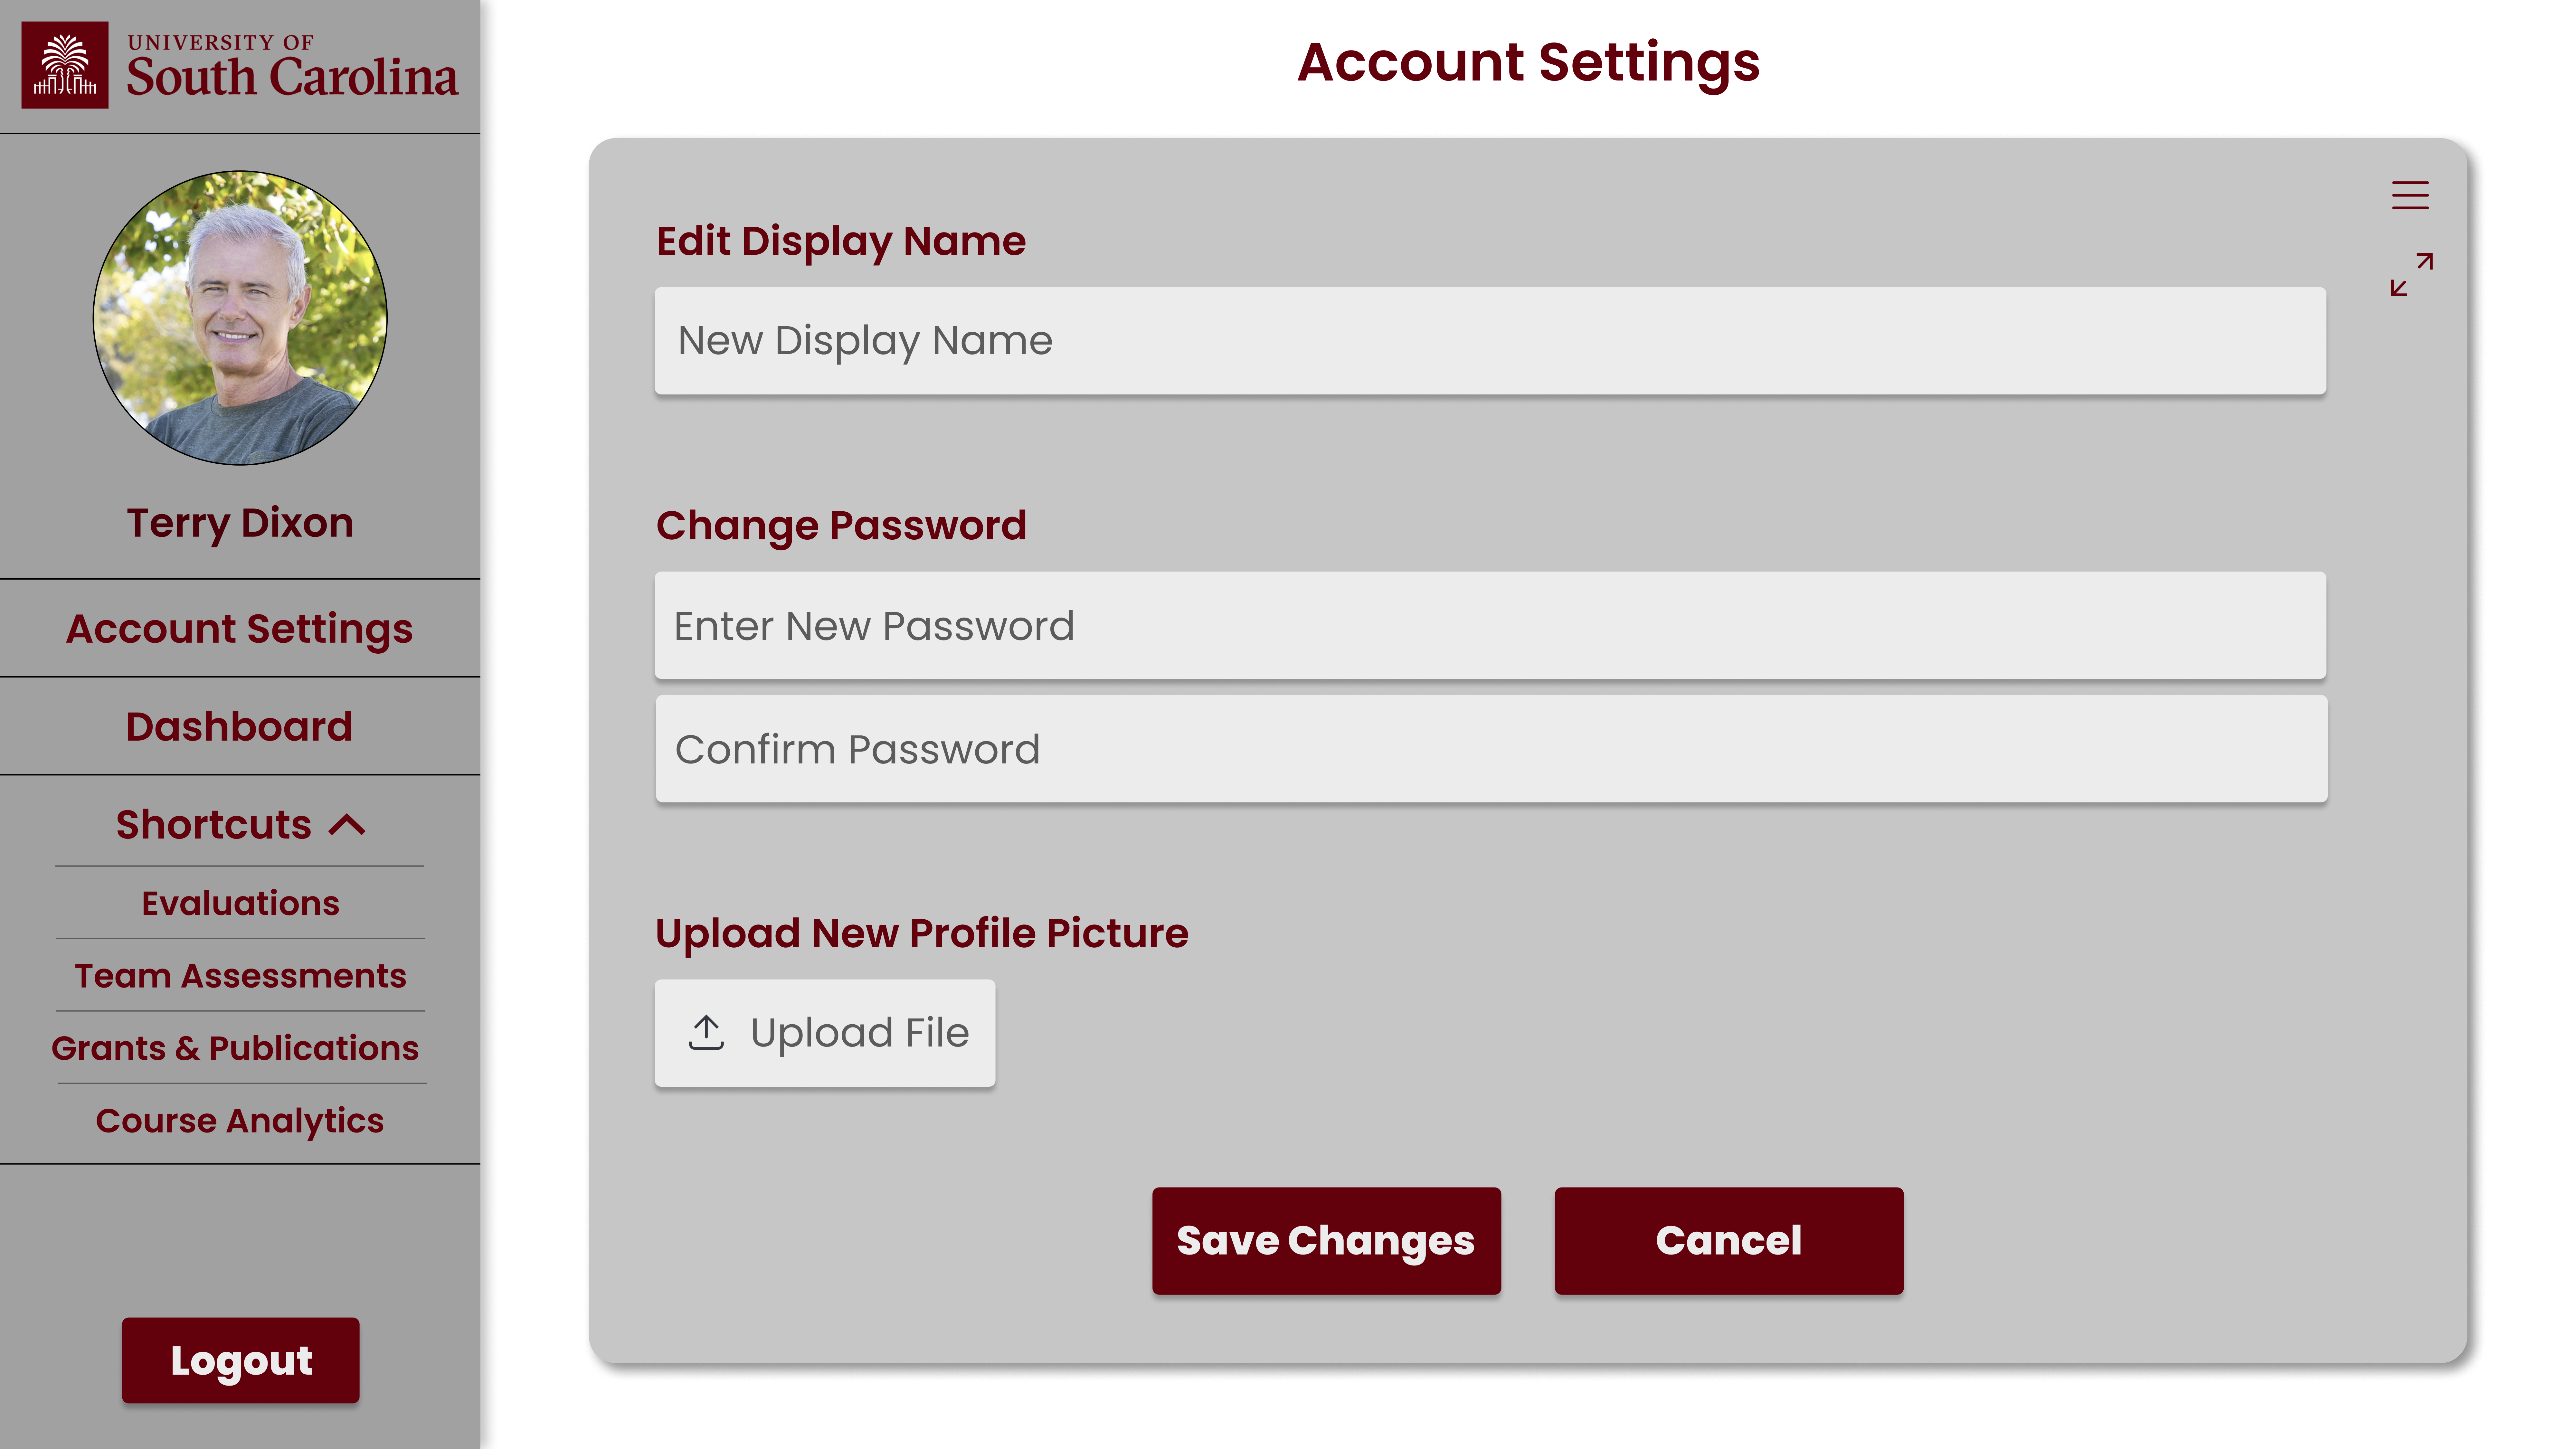
On this page, the user will be able to edit the name displayed on the sidebar. The user will also be able to enter a new password and a confirmation for that new password. Then the user can upload a profile picture (if they do not have one currently) or upload a new one (to replace their current one). All changes to the account should be saved when then Save Changes button is clicked, and all changes should be disregarded if the Cancel button is clicked. The sidebar functionality was discussed in the description of the Dashboard Page.
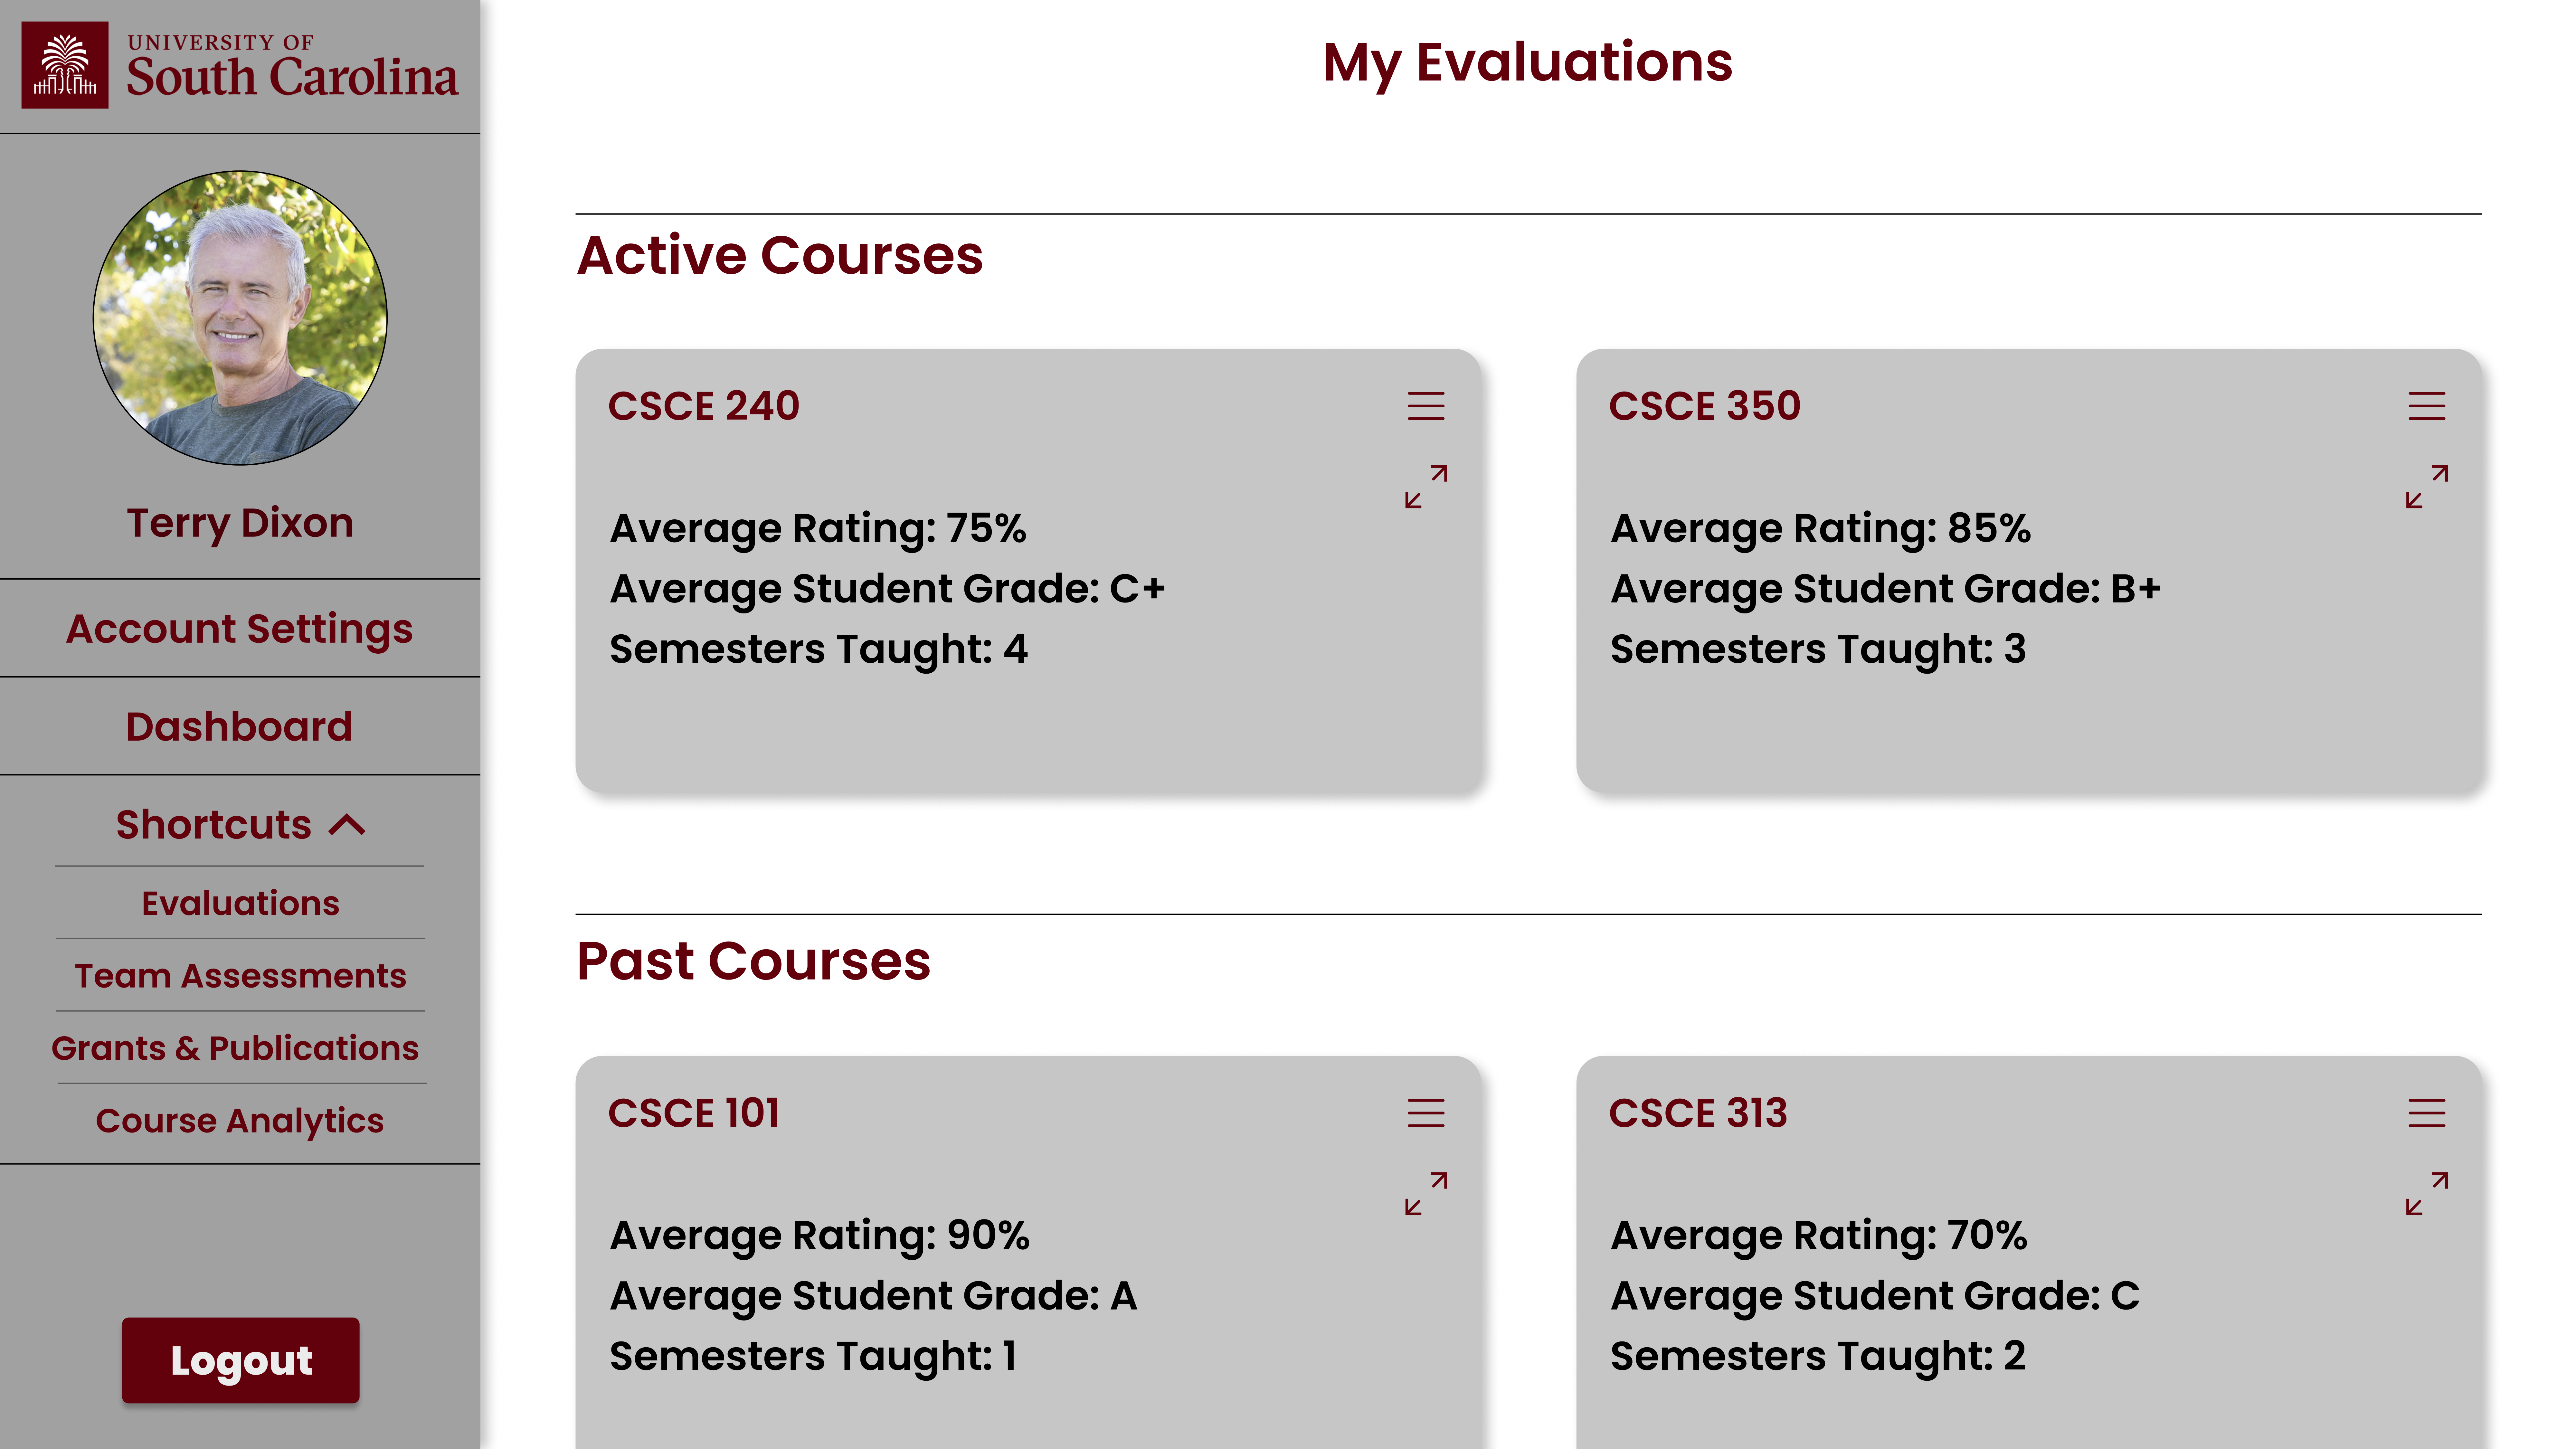
On this page, there should be cards displaying the Average Rating, Average Student Grade, and Semesters Taught for each of their current course. So each course they are currently teaching should have a card displaying that information. There should also be cards displaying the same information (Average Rating, Average Student Grade, and Semesters Taught) for each of the course they have previously taught. Again, each course they previously taught should have a card displaying that information. Each card should expand to display the information showed on the card on a large screen when the expand button on the left side of the card is clicked. Again, the sidebar functionality was discussed in the description of the Dashboard Page.

On this page, the users' average evaluations for the selected course should be displayed. The users' Evaluations by semester for the selected course should also be displayed in an easy to read manner. Also, the users' status (whether or not they are currently teaching the course and how many semesters they have taught the course) should be displayed on the top of the page to the right of the selected course. Again, the sidebar functionality was discussed in the description of the Dashboard Page.
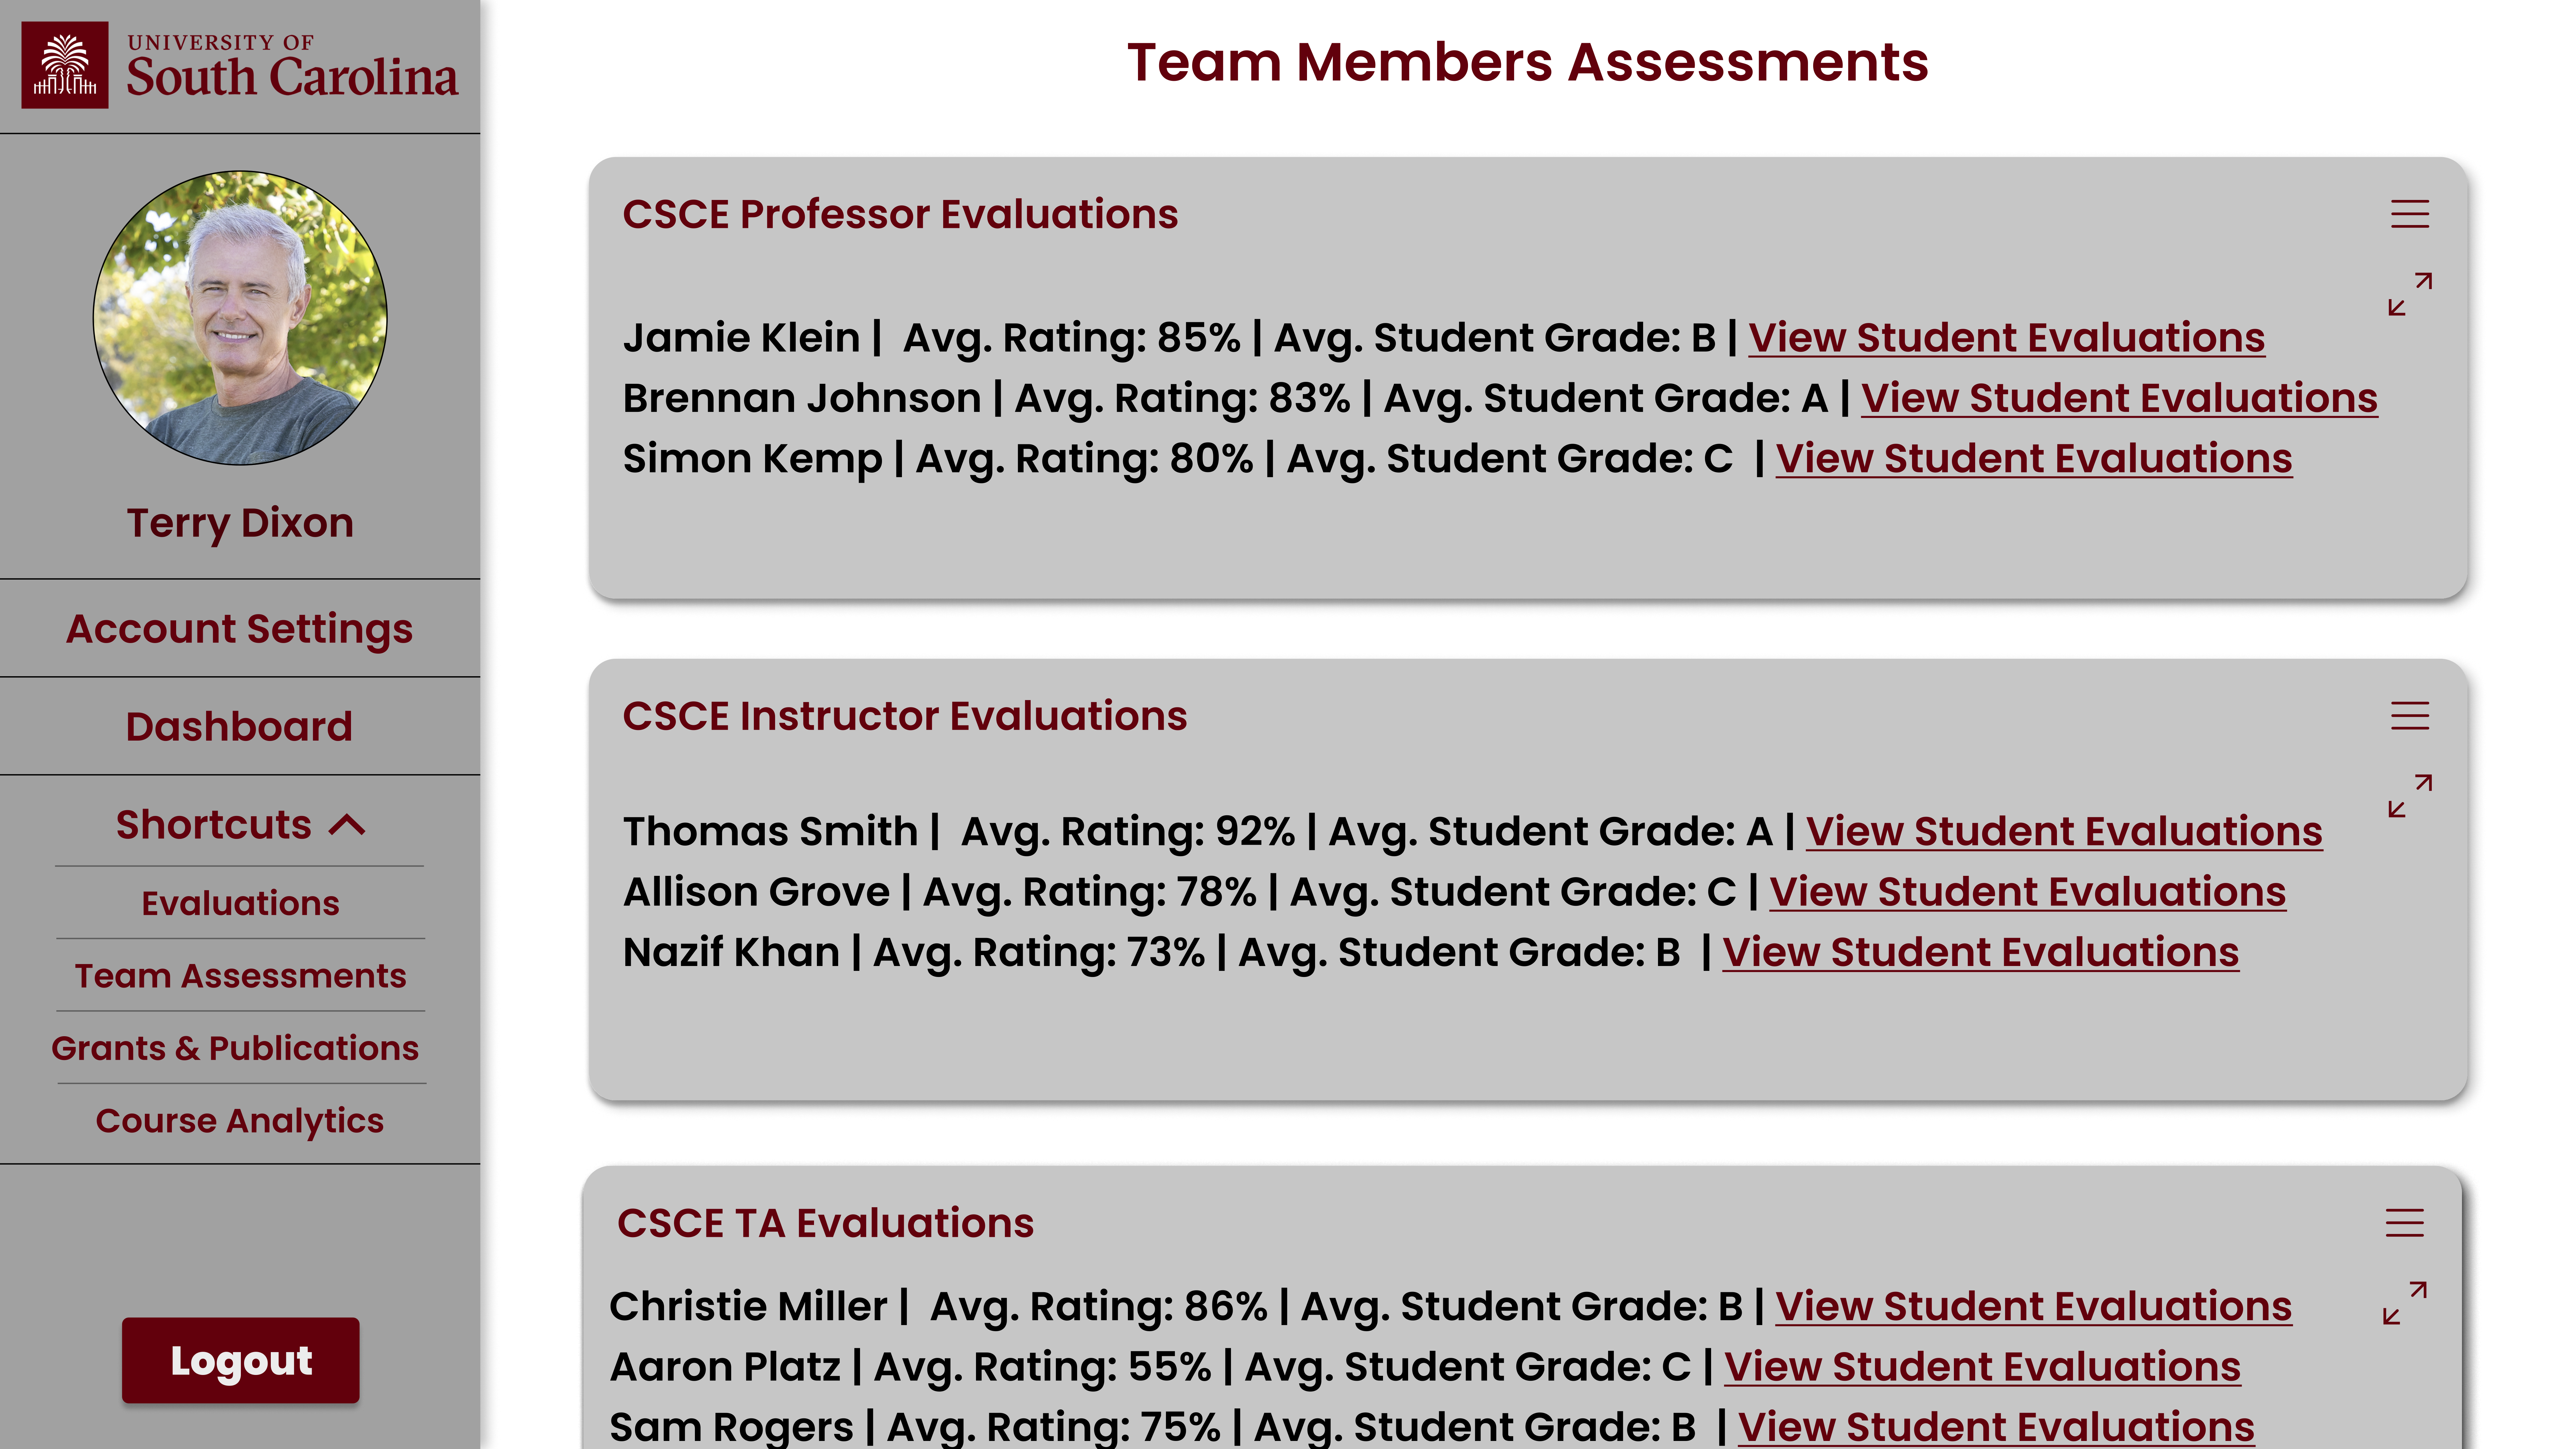
On this page, there should be cards displaying the team member Name (can be professors, instructors, or teaching assistants depending on user level), the Average Rating, the Average Student Grade, and a link to the member's student evaluations page. The data is the average of all their courses taught. There should be separate cards for each "level" of team members. So, professors, instructors, and ta's are put on separate cards. This page also has the sidebar functionality discussed in the description of the Dashboard Page.
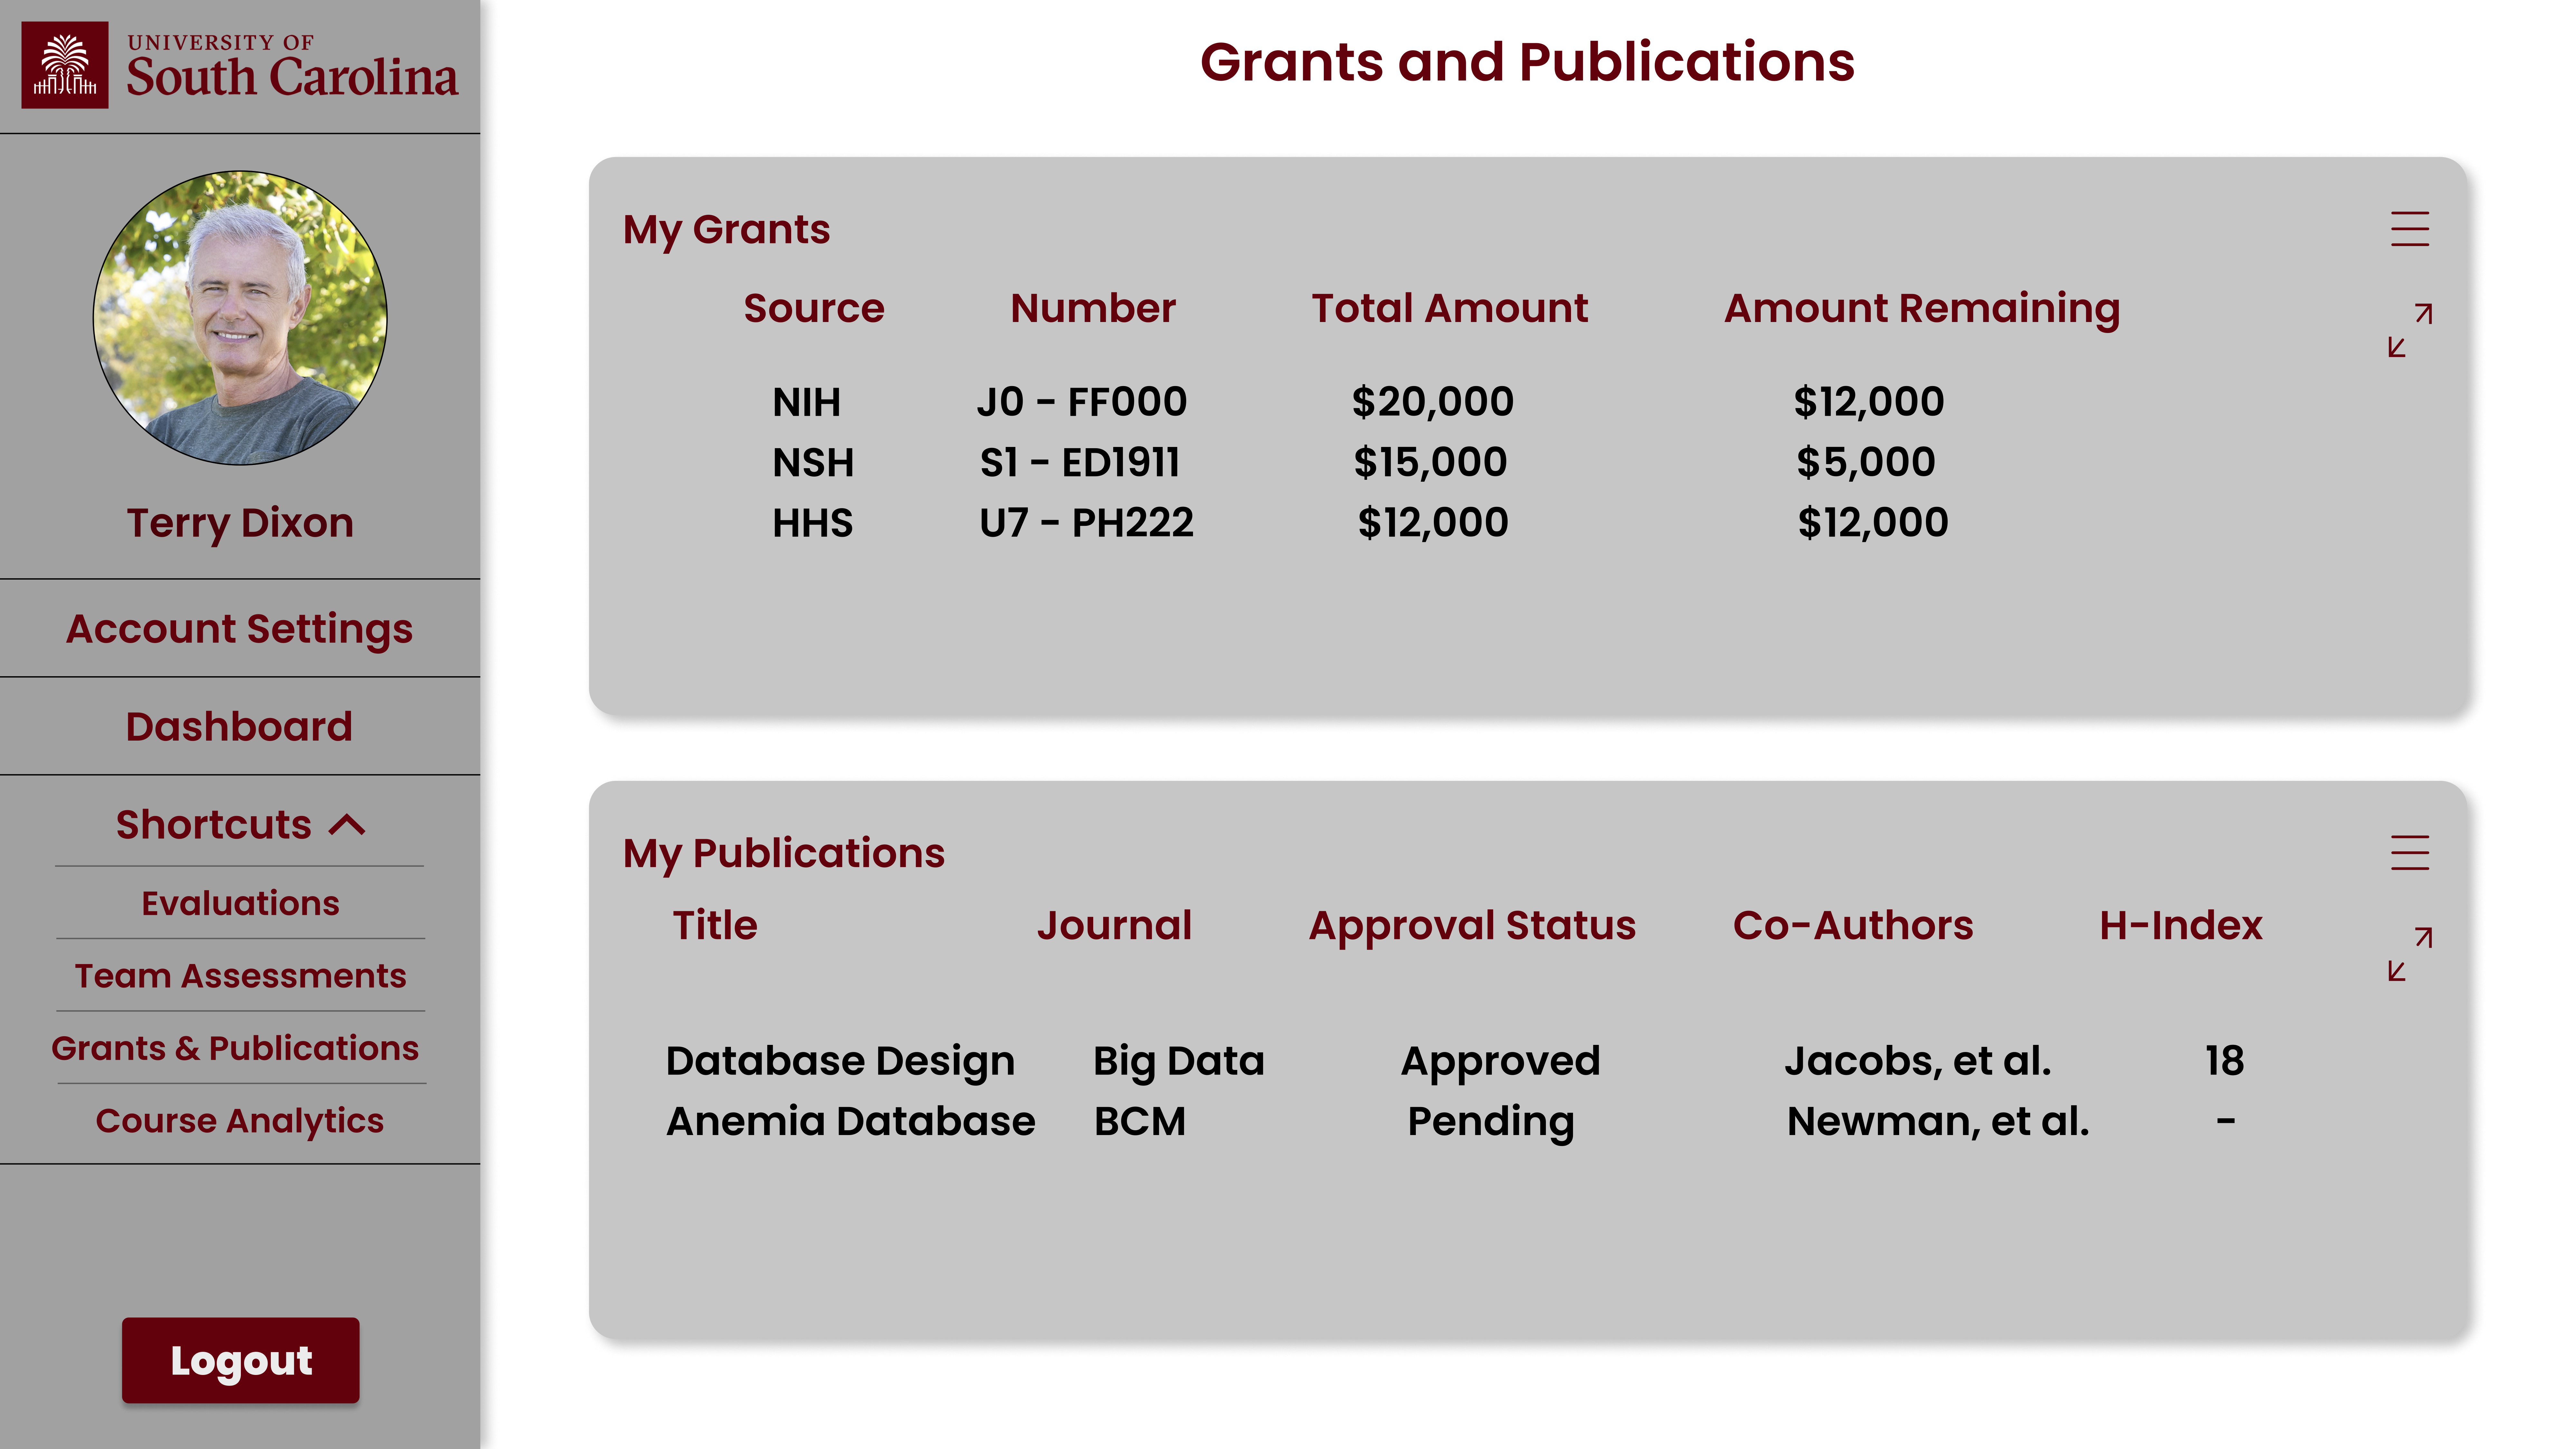
On this page, there should be a card displaying the user's grants; displaying the source (NIH, NSF, etc), the Number, the Total Amount, and the amount of remaining funds. There should also be another card displaying the user's publications, and publications they are co-authored on. This card should display the title, the journal published to, the approval status, the co-authors on the paper, and the H-index. Ofcourse, only the appropriate cards are shown based on the user's level (i.e. Instructors won't have a "My Grants" card). This page also has the sidebar functionality discussed in the description of the Dashboard Page.
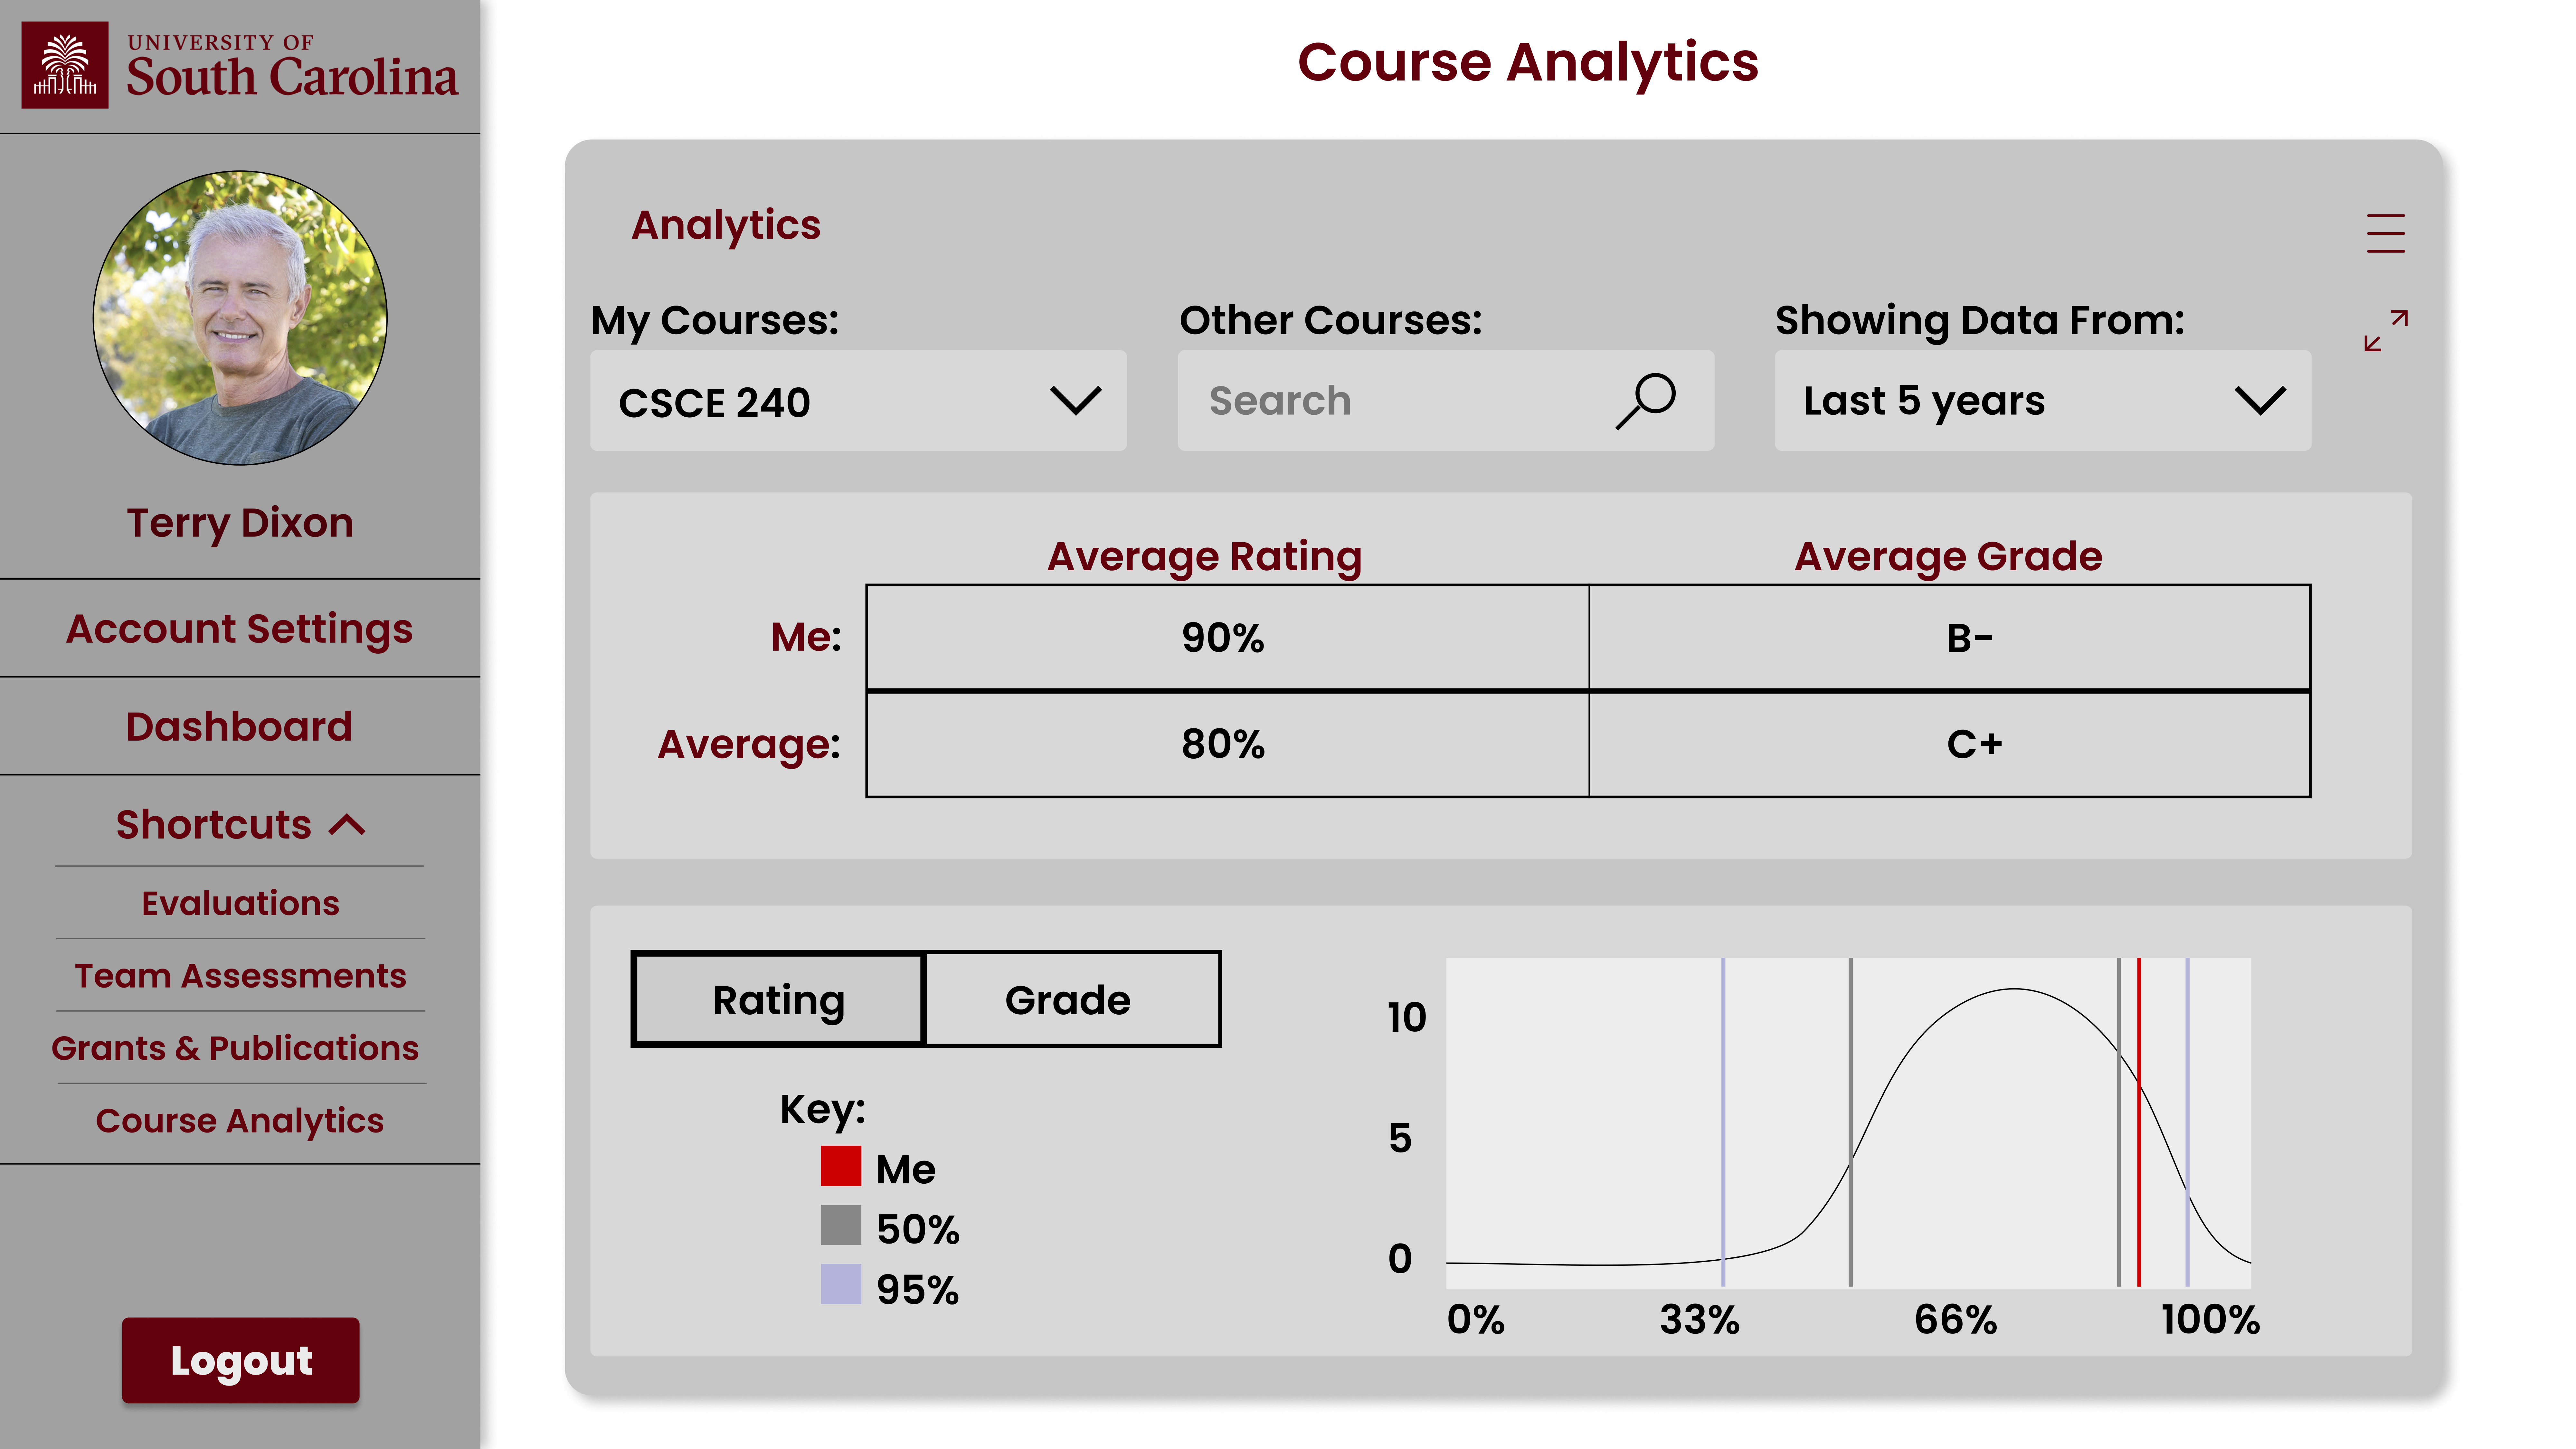
On this page, the user will be able to input the course(s) that he/she wants to evaluate. The user will be able to input this information through a dropdown (labeled “My Courses:”) which displays the user’s previously taught courses or by searching manually for a particular course (through the “Other Courses:” box). The user can also select the range of time over which they want the data to cover through another dropdown (labeled “Showing Data From:”). Below the inputs should exist two cards: a table display and a graphical display. The table card will show the user’s average rating (based on student evaluations) for the selected class along with the average grade received in said class, both as they relate to that of the average teacher of that course. The graphical card will show the user’s rating or grade statistics in the form of a graph based on a selectable button. This page also has the sidebar functionality discussed in the description of the Dashboard Page.
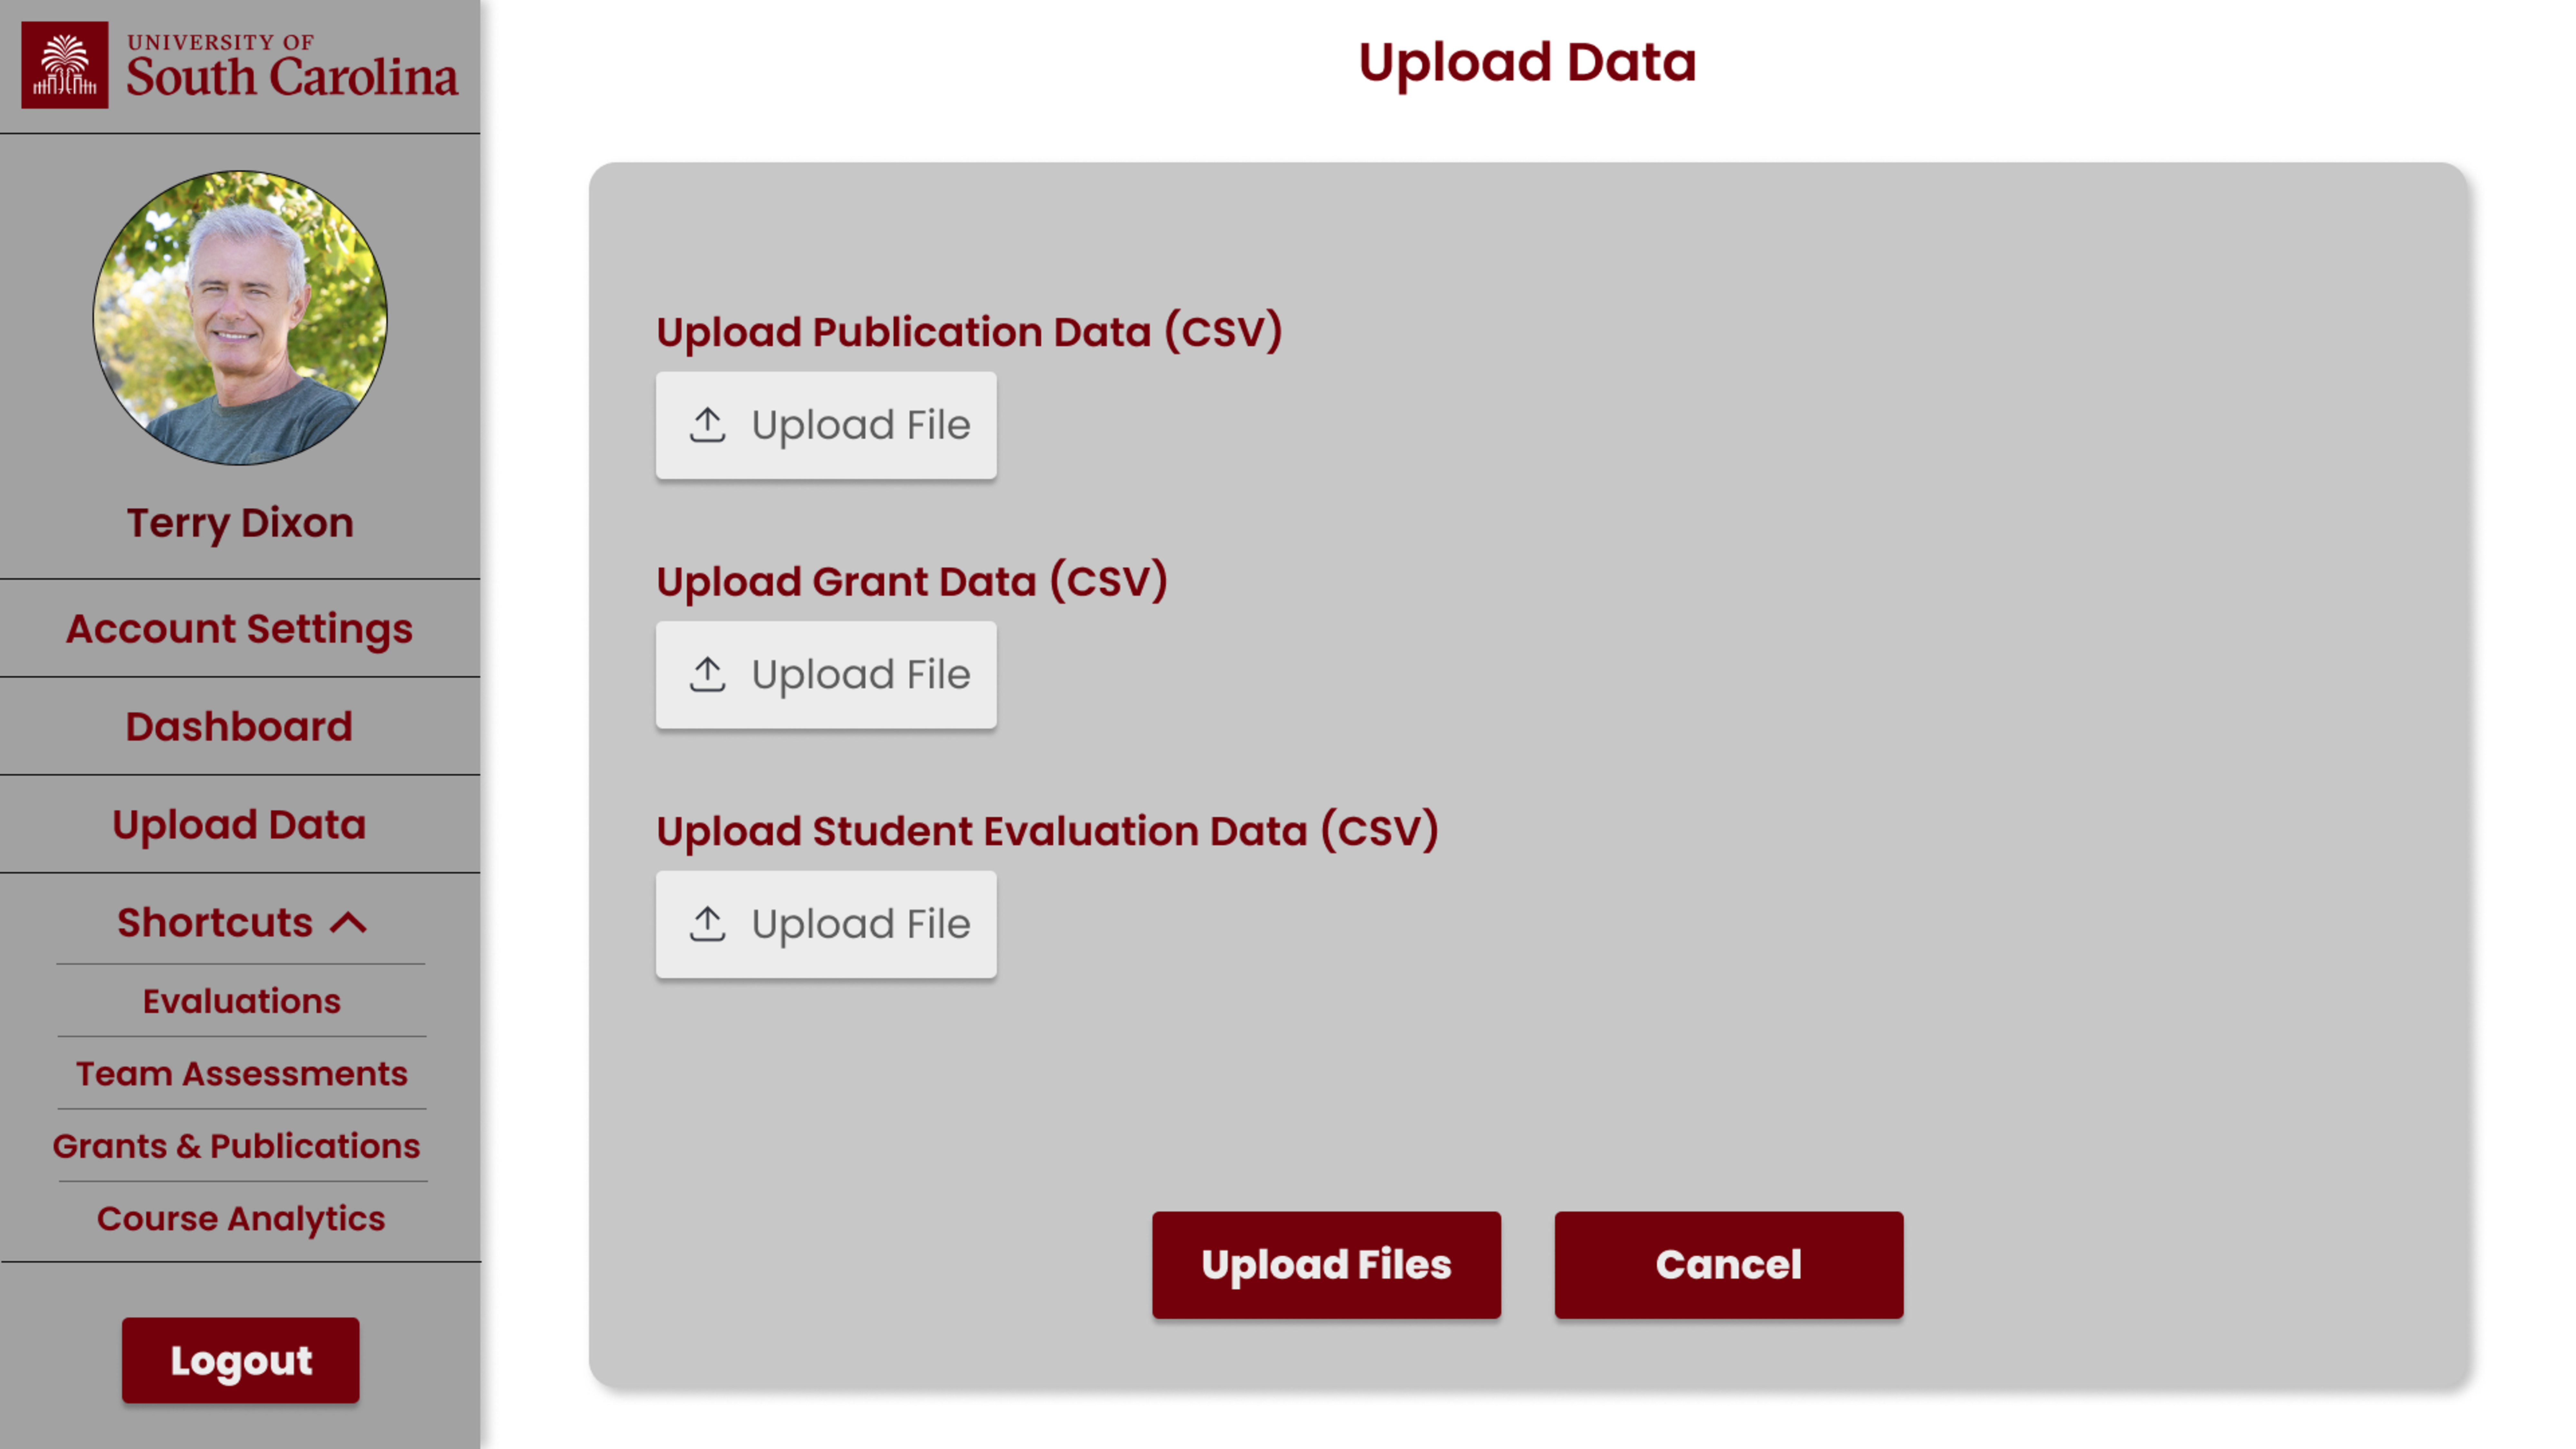
On this page, there should be three clickable “Upload File” buttons: one to upload publication data, one to upload grant data, and one to upload student evaluation data (each in the form of a CSV). When clicked, these buttons will pull up a file explorer window for the user to select their desired files. Once added, the file name(s) will appear underneath the respective button. Two more buttons should exist at the bottom of the screen: one labeled “Upload Files” and one labeled “Cancel”. If the user wants to proceed and upload all of their input files, clicking “Upload Files” will upload their files. If the user wants to cancel the process, clicking “Cancel” will unadd the selected files from being selected. This page also has the sidebar functionality discussed in the description of the Dashboard Page.