-
Notifications
You must be signed in to change notification settings - Fork 3
AnalyticUses
We initially planned to build a 2.5D TIN from the street vertices, performing the triangulation once in the plane and resetting the z axis based on individual search results. This surface would then be evaluated at a regular grid of points to produce a travel time raster.
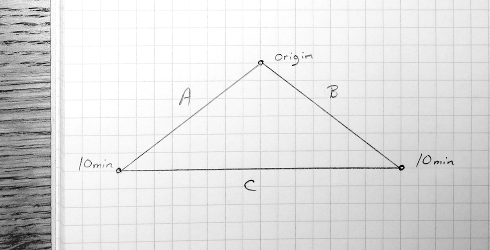
However, common interpolation techniques will give inaccurate results for travel time. For example, consider the following simple street graph in the form of a triangle:

The scale is 100 meters/grid cell, and the walk speed is 5/3 m/sec, or 1 cell/minute. The result of a Dijkstra search is a minimum travel time (and path) to each vertex in the graph: 0 minutes at the origin and 10 minutes at each of the other two vertices. We want to interpolate a 100-meter travel time raster from this search result. A cell halfway along edge C would be interpolated as 10 minutes from the origin, though it clearly takes 18 minutes to reach. A point 1/3 of the way from the midpoint of C to the origin would be interpolated as 6.6 minutes from the origin, though it is 20 minutes from the origin if only accessible from the nearest mapped road C.
Assuming that the graph contains all walkable paths and that the first and last steps of a trip are always going to/from the nearest walkable path, the distance from the origin is in fact well defined at all points, and we do not need to interpolate but rather infer that exact value using implicit edges.
Below is a visualization of a travel time raster for Portland built using this technique. Each color band represents 30 minutes of travel time in the order green, blue, yellow, red, magenta.

Consider the grid cells near Marine Drive, along the river "behind" the airport. The shortest path search gives comparable travel times to both ends of the road. Inferred travel time values increase from both ends toward the center of the segment, and moving out perpendicular to the road (note the angled shape of the transition from yellow to red). Off-road travel occurs at a velocity of 1.33 meters/sec, and is limited to 200 meters. Transit is not being used here so travel occurs at the same speed on the road as off it.

Example: Raster of population density disaggregated with Corine land cover (from the European Environment Agency) associated with vertices in an OTP graph