-
Notifications
You must be signed in to change notification settings - Fork 6
SazkaMobil performance
Lukáš Vozáb edited this page Jan 25, 2016
·
1 revision
Server infrastructure is composed of blade server Cisco UCS B200 with chassis Cisco 5108, Intel xeon 4CPU + 8GB RAM + 96GB HDD. We need more memory and space on filesystem because there are two other running applications on the same server.

Request average processing time is to 1 second.
Memory usage - current state (on average 1GB from overall 8GB)
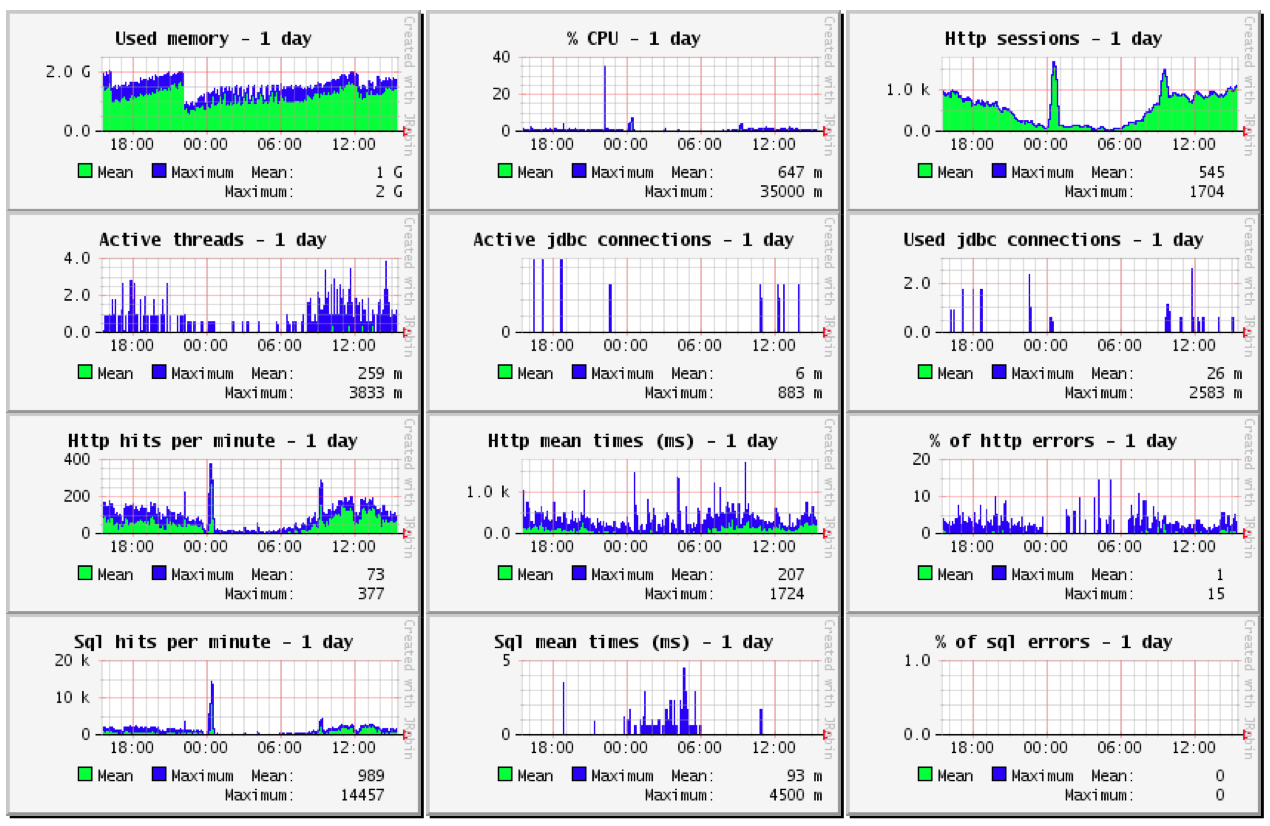
Overall count of requests during 10.9.2014: 91611
Asynchronous requests from overall count: 78576 (607 in state FAILED)
Average processing time of asynchronous message (last_update_timestamp - receive_timestamp): 0,003941
Average response time during the whole day: 470ms, min is not measured, max 02s 31,000ms
Request sizes:
- createOrderExt (order creation) – cca 2,89KB
- createTopUpExt (charging) - 1,36 KB
- updateSubscriberAssignedProducts - 1,44 KB
- getSubscriber - 276 bytes
Average size is 0,3KB, max. size is 3KB.
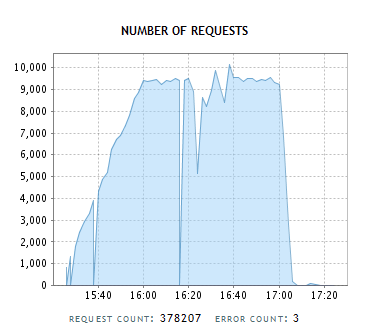
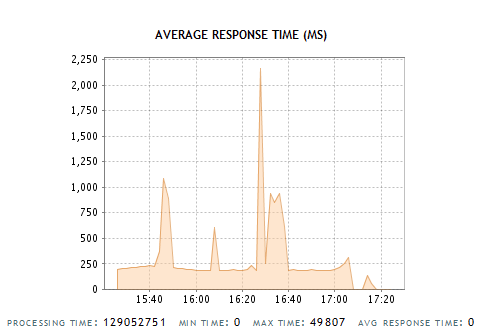
- load was 56 http requests / second
- overall count of requests: 378207
- average response time was 250ms, 2s during stress test because of external systems
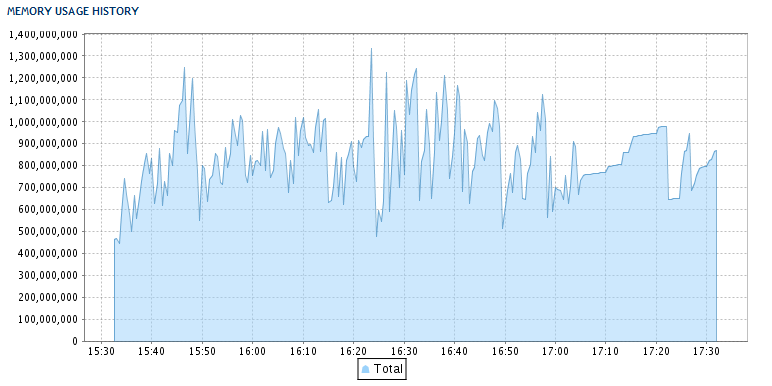
- memory was not higher than 1,3GB

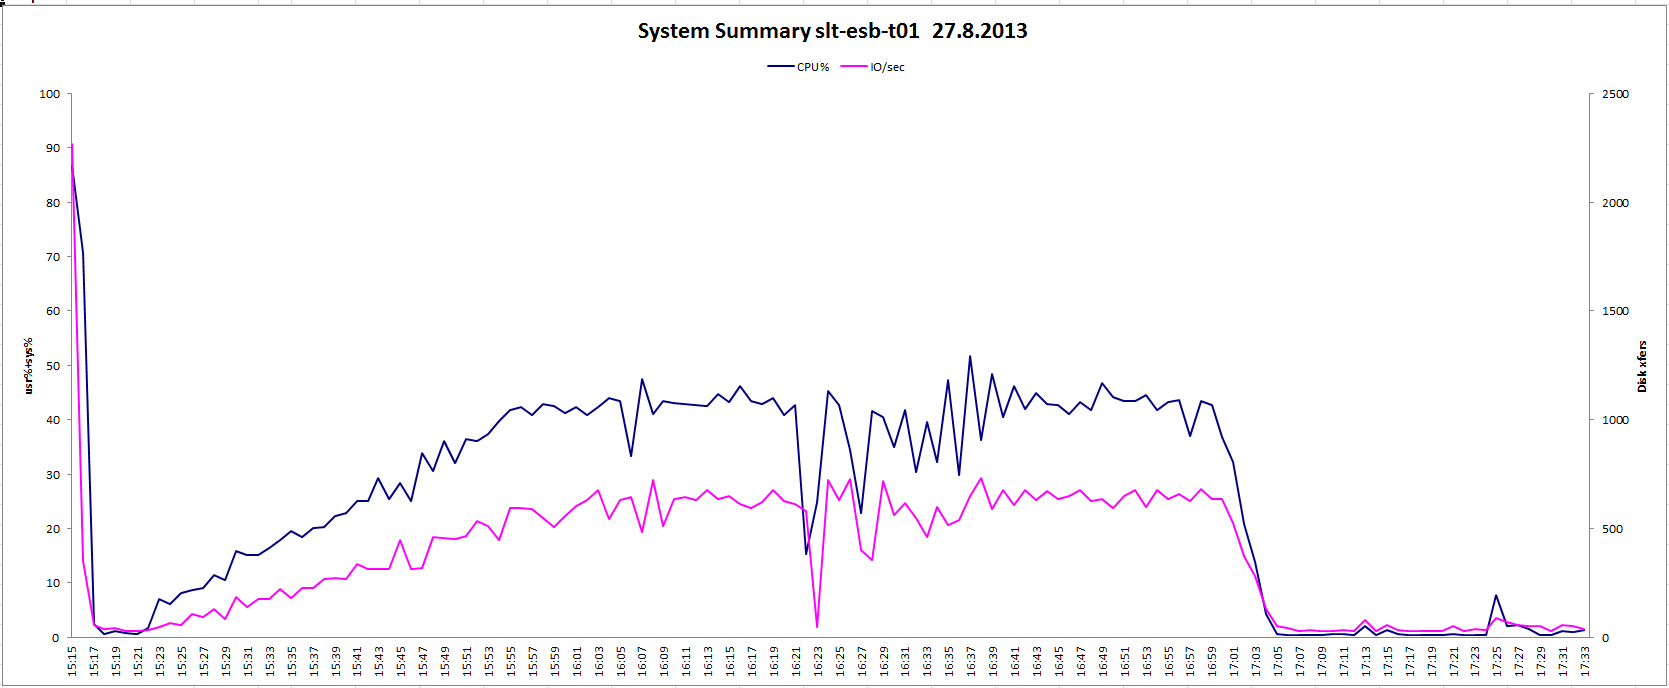
| Proxy | Selfcare | ESB | Billing | |
|---|---|---|---|---|
| # Cores | 2 | 8 | 2 | 10 |
| RAM [GB] | 3 | 10 | 3 | 64 |
| Proxy | Selfcare | ESB | Billing | |
|---|---|---|---|---|
| CPU % | 7 | 8 | 43 | 8 |
| I/O disk xfers | 38 | 650 | 600 | 38 |
| Disk Read KB/s | 20 | 0 | 500 | 10 |
| Disk Write KB/s | 350 | 5000 | 6500 | 380 |
| IO/s | 35 | 650 | 580 | 38 |
| Net I/O in MB/s | 2,8 | 0,7 | 1,3 | 2,5 |
| Net I/O out MB/s | 2,8 | 0,5 | 1,4 | 2,8 |
| pgpgin MB/s | 0,5 | 0 | 10 | 0,3 |
| pgpgout MB/s | 7 | 100 | 130 | 7 |
| pswpin MB/s | 0 | 0 | 0,6 | 0 |
| pswpout MB/s | 0 | 0 | 0,7 | 0 |
| Proxy | ESB | |
|---|---|---|
| Total Accesses | 345415 | 364918 |
| Total Traffic [GB] | 1,1 | 2,1 |
| requests/s | 56,6 | 60,6 |
| kB/second | 193 | 372 |
| ESB | Billing | |
|---|---|---|
| Sessions avg | 4500 | 30 |
| Requests total | 363551 | 392980 |
| Requests avg | 9000 | 10000 |
| Avg Response [ms] | 60 | 40 |
| Heap avg [GB] | 1 | 1 |