-
Notifications
You must be signed in to change notification settings - Fork 1
SBGN_Maps
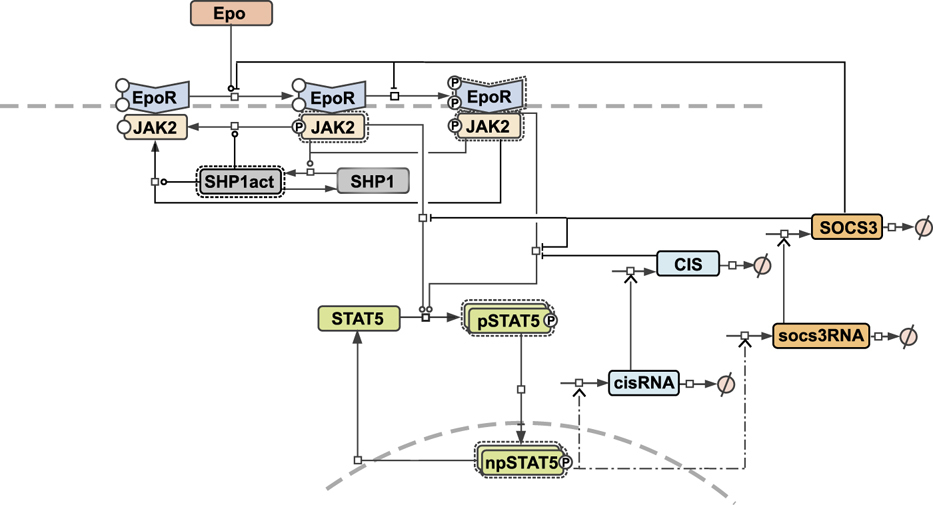
Figurative representation of data is a key factor to the rapid perception of information from it. This is reflected by a growing number of not only textual but visual abstracts of scientific publications. For mathematical models in systems biology, a graphical representation of the model is even a necessary condition for the understandability of the model, as argued by Schölzel et al. ([1]). The provision of the graphical representation of a model in a standardized, unambiguous form fosters the reusability and exchangeability of the model. The publication of the Bachmann model contains a process diagram of the model, which not uses a standard graphical notation (see below). We were not able to find any standardized graphical representation of the model in a model repository. Therefore, we provide a Systems Biology Graphical Notation (SBGN) ([2]) map within the COMBINE archive.
Figure 2 from Bachmann et al. 2011 ([3])

Mathematical model of dual negative feedback regulation of JAK2-STAT5 signaling. The model is represented as process diagram and reactions are modulated by enzyme catalysis (circle-headed lines) or inhibition (bar-headed lines). Dashed-dotted lines indicate delayed reactions used for RNA transcription. Prefix ‘p’ represents phosphorylated species and ‘n’ represents nuclear species. Binding of the ligand Epo to its cognate receptor results in phosphorylation of JAK2, which becomes activated. In a second step, EpoR is phosphorylated in the complex EpoRpJAK2. The pEpoRpJAK2 complex was modeled by considering different subclasses of phosphorylated tyrosines at the receptor (see Supplementary Material Section 2.2). STAT5 is recruited by pEpoR and phosphorylated by pJAK2, dimerizes and translocates to the nucleus. As target genes of STAT5, the negative feedback proteins CIS and SOCS3 are expressed, which inhibit the pathway. For an extended model description, see Supplementary information.
[1] Schölzel, C., Blesius, V., Ernst, G. et al. Characteristics of mathematical modeling languages that facilitate model reuse in systems biology: a software engineering perspective. npj Syst Biol Appl 7, 27 (2021). https://doi.org/10.1038/s41540-021-00182-w
[2] Novère, N., Hucka, M., Mi, H. et al. The Systems Biology Graphical Notation. Nat Biotechnol 27, 735–741 (2009). https://doi.org/10.1038/nbt.1558
[3] Bachmann, J., Raue, A., Schilling, M. et al. Division of labor by dual feedback regulators controls JAK2/STAT5 signaling over broad ligand range. Molecular Systems Biology 7, 516 (2011). https://doi.org/10.1038/msb.2011.50
Bioinformatics & Systems biology SS 2021
- Synopsis Group 1
- Sources of Bachmann model
- Software tools for simulation
- How to build a Fully Featured COMBINE Archive?
- Communication channels
- Provision of a template for documentation
- Schedule (draft)
- Review of results
- COMBINE Archive (Testversion!)
- Synopsis Group 2
- Finding of SBML models
- Comparison of SBML models
- The chosen one
- Simulation tools
- Metadata
- Improving metadata annotations
- Synopsis Group 3
- SBGN Maps for Bachmann model
- Choice of SBGN language
- Tool to draw the SBGN Map
- SBGN-Map Drawing, Validation & Beautification
- Integration into COMBINE Archive
- Synopsis Group 4
- Selection of experiments
- Selection of SED-ML tool(s)
- Generation of SED-ML file(s)
- Integration into COMBINE Archive
- Test of SED-ML files and COMBINE Archive