Integration of single-nucleus and spatial transcriptomics reveals the molecular landscape of the human hippocampus
Welcome to the spatial_HPC project! In this study, we generated
spatially-resolved transcriptomics (SRT) and single-nucleus
RNA-sequencing (snRNA-seq) data from adjacent tissue sections of the
anterior human hippocampus across ten adult neurotypical donors. SRT
data was generated using 10x Genomics
Visium
(n=36 capture areas) and 10x Genomics Visium Spatial Proteogenomics
(SPG) (n=8
capture areas). snRNA-seq data was generated using 10x Genomics
Chromium
(n=26 total snRNA-seq libraries).
If you tweet about this website, the data or the R package please use
the #spatial_HPC hashtag. You can find previous tweets
that way as shown
here.
Thank you for your interest in our work!
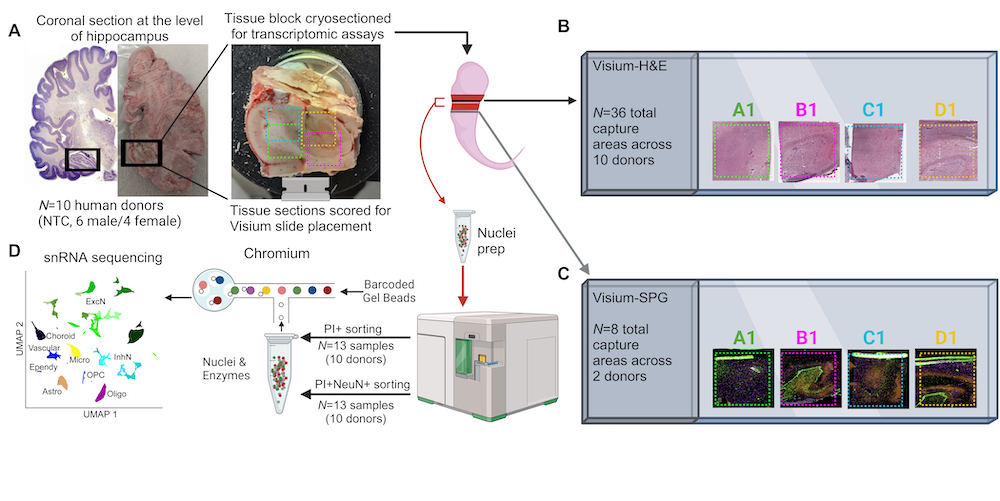
Experimental design to generate paired single-nucleus RNA-sequencing (snRNA-seq) and spatially-resolved transcriptomics (SRT) data in the human hippocampus. (A) Postmortem human tissue blocks from the anterior hippocampus were dissected from 10 adult neurotypical brain donors. Tissue blocks were scored and cryosectioned for snRNA-seq assays (red), and placement on Visium slides (Visium H&E, black; Visium Spatial Proteogenomics (SPG), yellow). (B) 10μm tissue sections from all ten donors were placed onto 2-5 capture areas to include the extent of the HPC(n=36 total capture areas), for measurement with the 10x Genomics Visium H&E platform. (C) 10μm tissue sections from two donors were placed onto 4 capture areas (n=8 total capture areas) for measurement with the 10x Genomics Visium-SPG platform. (D) Tissue sections (2-4 100μm cryosections per assay) from all ten donors were collected from the same tissue blocks for measurement with the 10x Genomics 3’ gene expression platform. For each donor, we sorted on both and PI+NeuN+ (n=26 total snRNA-seq libraries). (This figure was created with Biorender)
All of these interactive websites are powered by open source software, namely:
We provide the following interactive websites, organized by dataset with software labeled by emojis:
- Visium (n = 44)
- 👀 https://libd.shinyapps.io/pseudobulk_HPC/
- Provides tools for visualization of pseudobulked Visium data.
- 🔍 HPC Samui
browser
- Provides interactive spot-level visualization of Visium data.
- 👀 https://libd.shinyapps.io/pseudobulk_HPC/
- snRNA-seq (n = 26)
- 👀 https://libd.shinyapps.io/HPC_snRNAseq_data/
- Provides tools for visualization of snRNA-seq data.
- 👀 https://libd.shinyapps.io/HPC_snRNAseq_data/
All data, including raw FASTQ files and SpaceRanger/CellRanger
processed data outputs, can be accessed via Gene Expression Omnibus
(GEO) under accessions
GSE264692
(SRT) and
GSE264624
(snRNA-seq).
We value public questions, as they allow other users to learn from the answers. If you have any questions, please ask them at LieberInstitute/spatial_hpc/issues and refrain from emailing us. Thank you again for your interest in our work!
- JHPCE location:
/dcs04/lieber/lcolladotor/spatialHPC_LIBD4035/spatial_hpc
code: Scripts for running all analyses.plots: plots generated by analysis scripts.processed-dataImages: images used for runningSpaceRangerandVistoSeg.spaceranger:SpaceRangeroutput files.
raw-datasample_info: metadata about samples.
snRNAseq_HPC: code, plots, and data for snRNA-seq analyses.- Code for running
GraphSTclustering pipeline can be found here: https://github.com/JianingYao/SpatialHPC_graphST_multipleSample
This GitHub repository is organized along the R/Bioconductor-powered Team Data Science group guidelines. It follows the LieberInstitute/template_project structure.
