ガウス過程モデルを実行するためのモジュールを作成しました。 GPyTorchをベースにコードを実装しています。
from eagpytorch import RunApproximateGP
from eagpytorch import RunExactGP
from eagpytorch import Regressor
from eagpytorch import Classifier
from eagpytorch.utils import *
import matplotlib.pyplot as plt
import numpy as np
load data
_, data = load_data('./data/sample_data_1.csv')
data = np.array(data)
x = np.array(data)[:,0]
y = np.array(data)[:,1]
test_x = np.linspace(0, 1, 200)
create instance, fit and predict
regressor = Regressor.Exact()
regressor.set_model(x, y, lr=1e-2)
regressor.fit(20000)
predicts = regressor.predict(test_x, sample_num=10, sample_f_num=10)
plot
plt.style.use('seaborn-darkgrid')
fig = plt.figure(figsize=(6, 8))
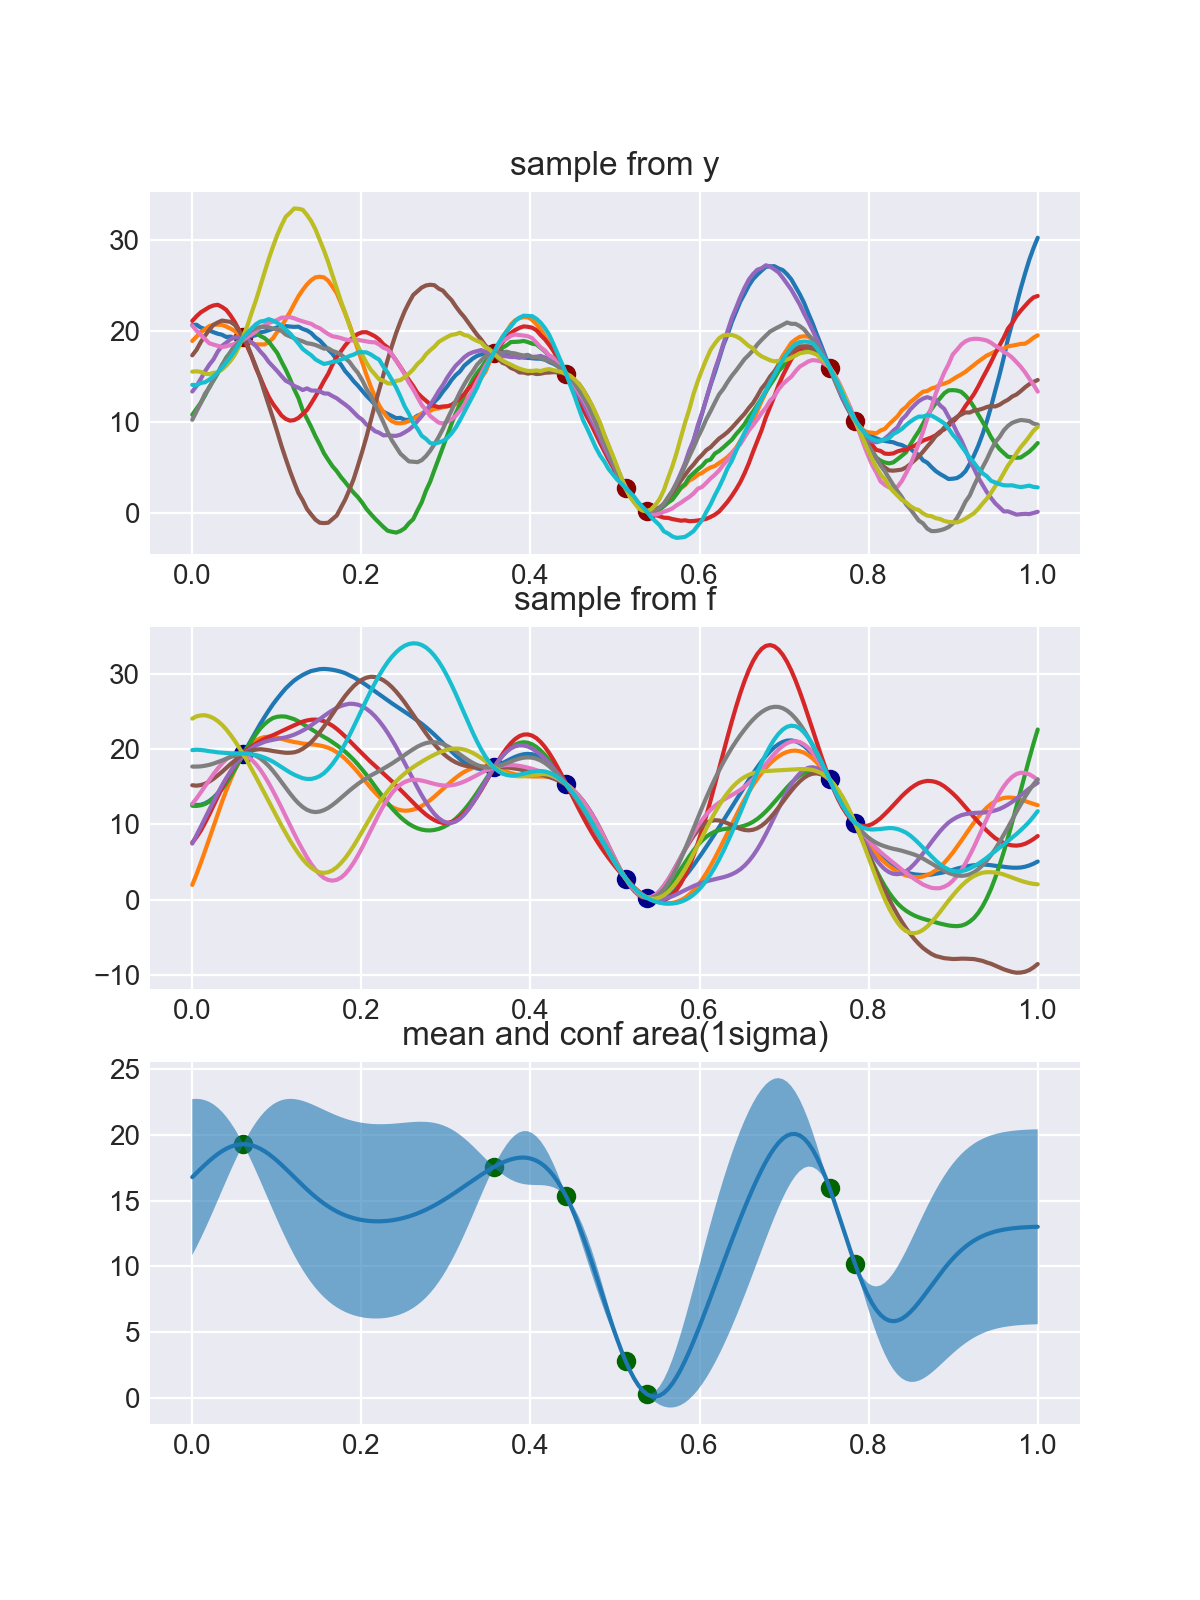
ax1 = fig.add_subplot(3, 1, 1, title='sample from y')
ax1.scatter(x, y, c='darkred')
for i in range(10):
    ax1.plot(test_x, predicts.samples[i])

ax2 = fig.add_subplot(3, 1, 2, title='sample from f')
ax2.scatter(x, y, c='darkblue')
for i in range(10):
    ax2.plot(test_x, predicts.samples_f[i])

ax3 = fig.add_subplot(3, 1, 3, title='mean and conf area(1sigma)')
ax3.scatter(x, y, c='darkgreen')
ax3.plot(test_x, predicts.mean)
ax3.fill_between(
    test_x,
    predicts.upper,
    predicts.lower,
    alpha=0.6,
    label='var'
)
plt.show()
出力結果
Requirements:
- Python >= 3.6
- PyTorch >= 1.5
Install eaGPyTorch using pip:
pip install eagpytorchFor developer
pip install -e .[dev]or
pip install -r env/requirements.txtcreate packages
python setup.py sdist
python setup.py bdist_wheel
upload pypi
python -m twine upload --repository pypi dist/eagpytorch-<version>*upload testpypi
python -m twine upload --repository-url https://test.pypi.org/legacy/ --skip-existing dist/eagpytorch-<version>*ドキュメント作成用のパッケージのインストール
pip install -e .[docs]python setup.py build_sphinx
