-
Notifications
You must be signed in to change notification settings - Fork 0
Usage
- RedPitaya
- Cloned pyrpl repository on the open_fpga_fads branch
- Oscilloscope (for an unbiased view of what the RedPitaya is seeing and doing)
- Function generator (just for testing/evaluation purposes)
- Create a conda environment for pyrpl
conda create -y -n pyrpl-env numpy scipy paramiko pandas nose pip pyqt qtpy pyqtgraph pyyaml
conda activate pyrpl-env- Clone the pyrpl repository at the branch and install pyrpl
git clone https://github.com/npeschke/pyrpl@open_fpga_fads
cd pyrpl
python setup.py developFollow the pyrpl guide for preparing the hardware.
Afterwards copy the pyrpl/fads_logger directory to your RedPitaya
cd pyrpl/fads_logger
scp * root@<RedPitaya Hostname>:/root/mybin/logger
Connect to the RedPitaya over ssh and build the logger application
ssh root@<RedPitaya Hostname>
cd /root/mybin/logger

makeRun pyrpl on your computer (not the RedPitaya). To do so, start a new terminal tab and activate the conda environment (make sure you are in the top pyrpl directory)
conda activate pyrpl-env
python -m pyrpl example_filename
and follow the instructions for a basic setup.
CAUTION: DO NOT RUN THE LOGGER WHILE YOU START PYRPL! Pyrpl will overwrite the bitstream of the FPGA and if the logger is logging during this period, the bitstream write will fail and the RedPitaya needs to be restarted.
- Add the
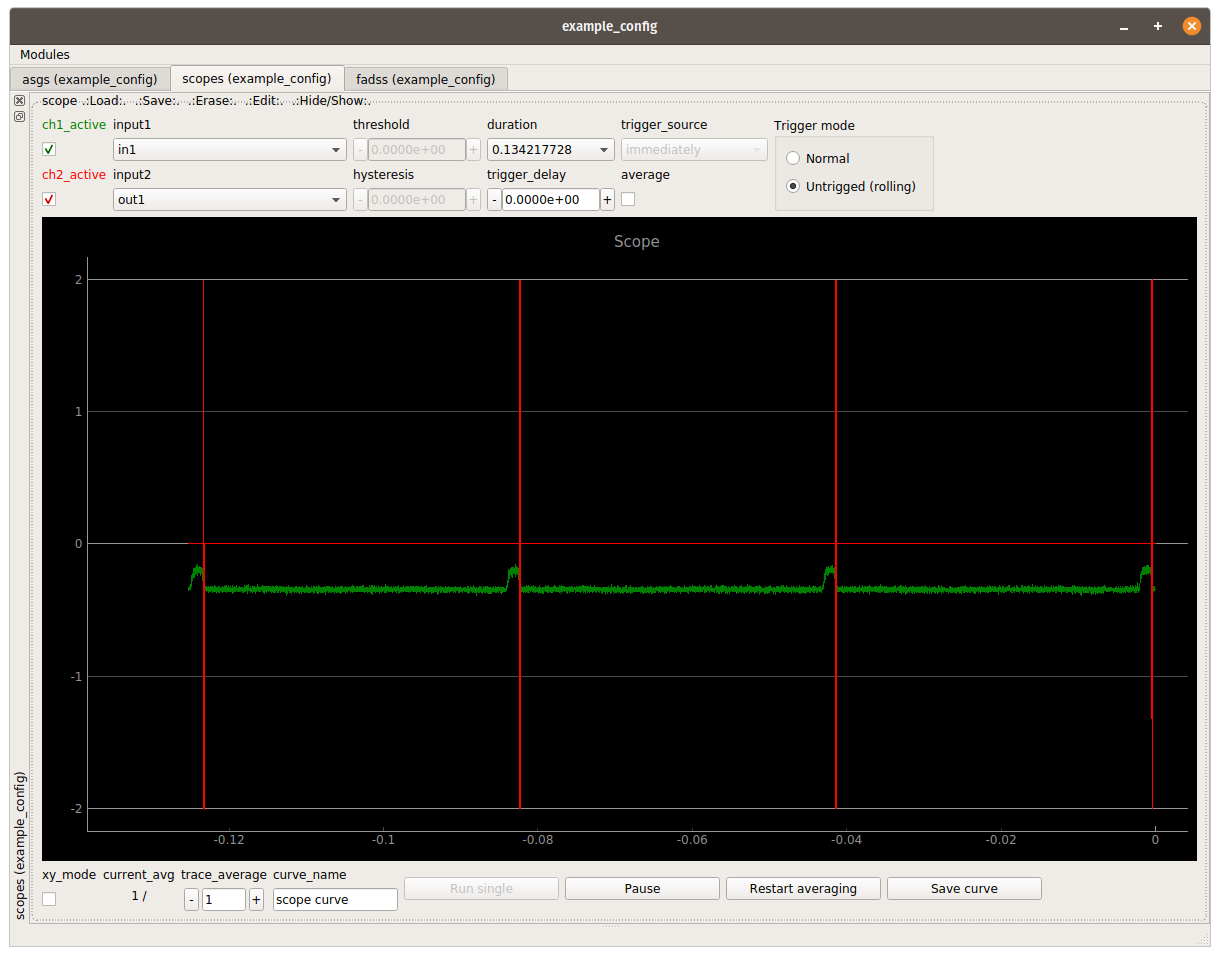
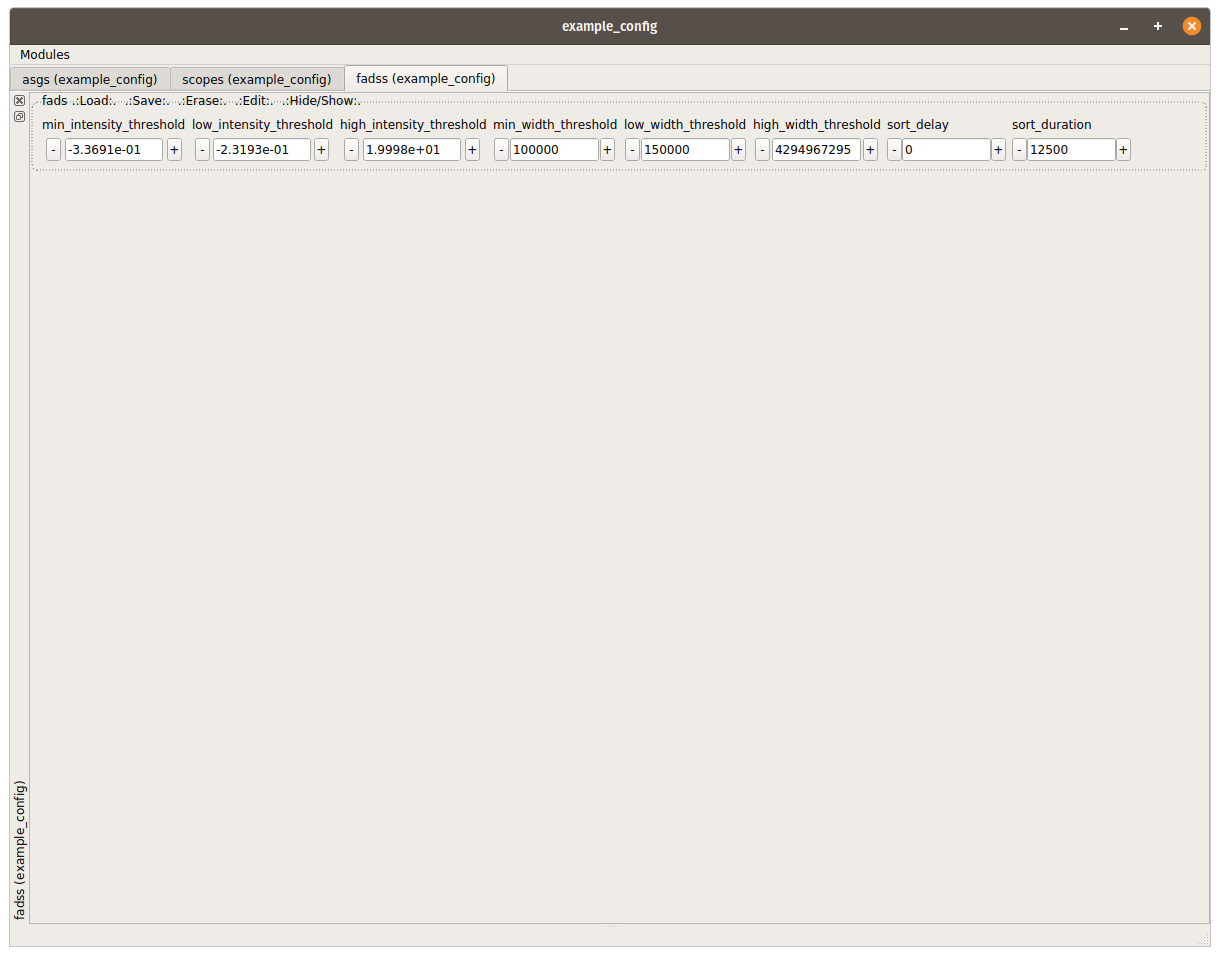
asgs,scopesand thefadssmodules to the gui. - Set the following defaults


- Connect the photodetector to IN1 and the high voltage amplifier to OUT1
Run the following command in a ssh connection to the RedPitaya.
./fads_logger > /PATH/TO/LOGFILEand replace the path with one of your liking. You need to be in the logger directory (default /root/mybin/logger) for this to work.
CAUTION: This will overwrite the file if it already exists.
CAUTION: Keep the caveats in mind
CAUTION: DO NOT RUN THE LOGGER WHILE YOU START PYRPL! Pyrpl will overwrite the bitstream of the FPGA and if the logger is logging during this period, the bitstream write will fail and the RedPitaya needs to be restarted.
Currently, the logfile contains the following columns:
- Droplet ID (Basic autoincrementing counter of everything that reached
min_intensity_threshold) - Droplet intensity maximum (Raw value from the ADC before conversion)
- Droplet intensity maximum (Scaled to the HV +-20V range of the RedPitaya but NOT calibrated)
- Droplet width in FPGA clock cycles (125 MHz clock)
- Droplet width in milliseconds
- Encoded droplet classification
- Time in µs after last pyrpl start or reset
         270             -54    -0.131836             190149    1.521192         17
         271             -55    -0.134277             189880    1.519040         17
         272             -50    -0.122070             189561    1.516488         17
         273             -51    -0.124512             190321    1.522568          1
         274             -56    -0.136719             190426    1.523408         17
         275             -52    -0.126953             188813    1.510504         17
         276             -55    -0.134277             190356    1.522848         17
         277             -55    -0.134277             190898    1.527184         17
         278             -52    -0.126953             192923    1.543384         17
         279             -53    -0.129395             189686    1.517488         17
         280             -53    -0.129395             190988    1.527904          1
The classification is made up of a 8 bit wide word. Each bit represents a flag for a specific classification:
| Bit | Decimal | Purpose |
|---|---|---|
| 7 | 128 | Positive Droplet |
| 6 | 64 | Currently unused |
| 5 | 32 | High Width |
| 4 | 16 | Positive Width |
| 3 | 8 | Low Width |
| 2 | 4 | High Intensity |
| 1 | 2 | Positive Intensity |
| 0 | 1 | Low Intensity |
The decimal values are summed up for set flags and the sum is displayed as the encoded classifcation.
Example:
Classification: 146
              Bits 76543210
                   ||||||||
146 (in base 10) = 10010010 (in base 2 or binary)
                   |  |  ∟ Positive Intensity
                   |  ∟ Positive Width
                   ∟ Positive Droplet

Classification: 17
              Bits 76543210
                   ||||||||
17 (in base 10)  = 00010001 (in base 2 or binary)
                      |   ∟ Low Intensity
                      ∟ Positive Width
-
Take care of potential impedance mismatches between Photodetector and the High-Z RedPitaya scope
-
Thresholds can be tweaked using the scope screen and when daisy-chaining a Oscilloscope
- It is recommended to set the low and high thresholds to their maximum values (-2, 2 for intensity and 0 and 2^32 for width) first
- Afterwards the min thresholds can be tweaked
- Then the low and high thresholds
- Finally the sort delay and sort duration
-
The LEDs on the Red Pitaya encode the state of the state machine and thus, give an insight into what is happening
-
To Reset the FADS you can set the address 0x40600020 to 1 and afterwards back to 0 on the RedPitaya
monitor 0x40600020 0x1
monitor 0x40600020 0x0