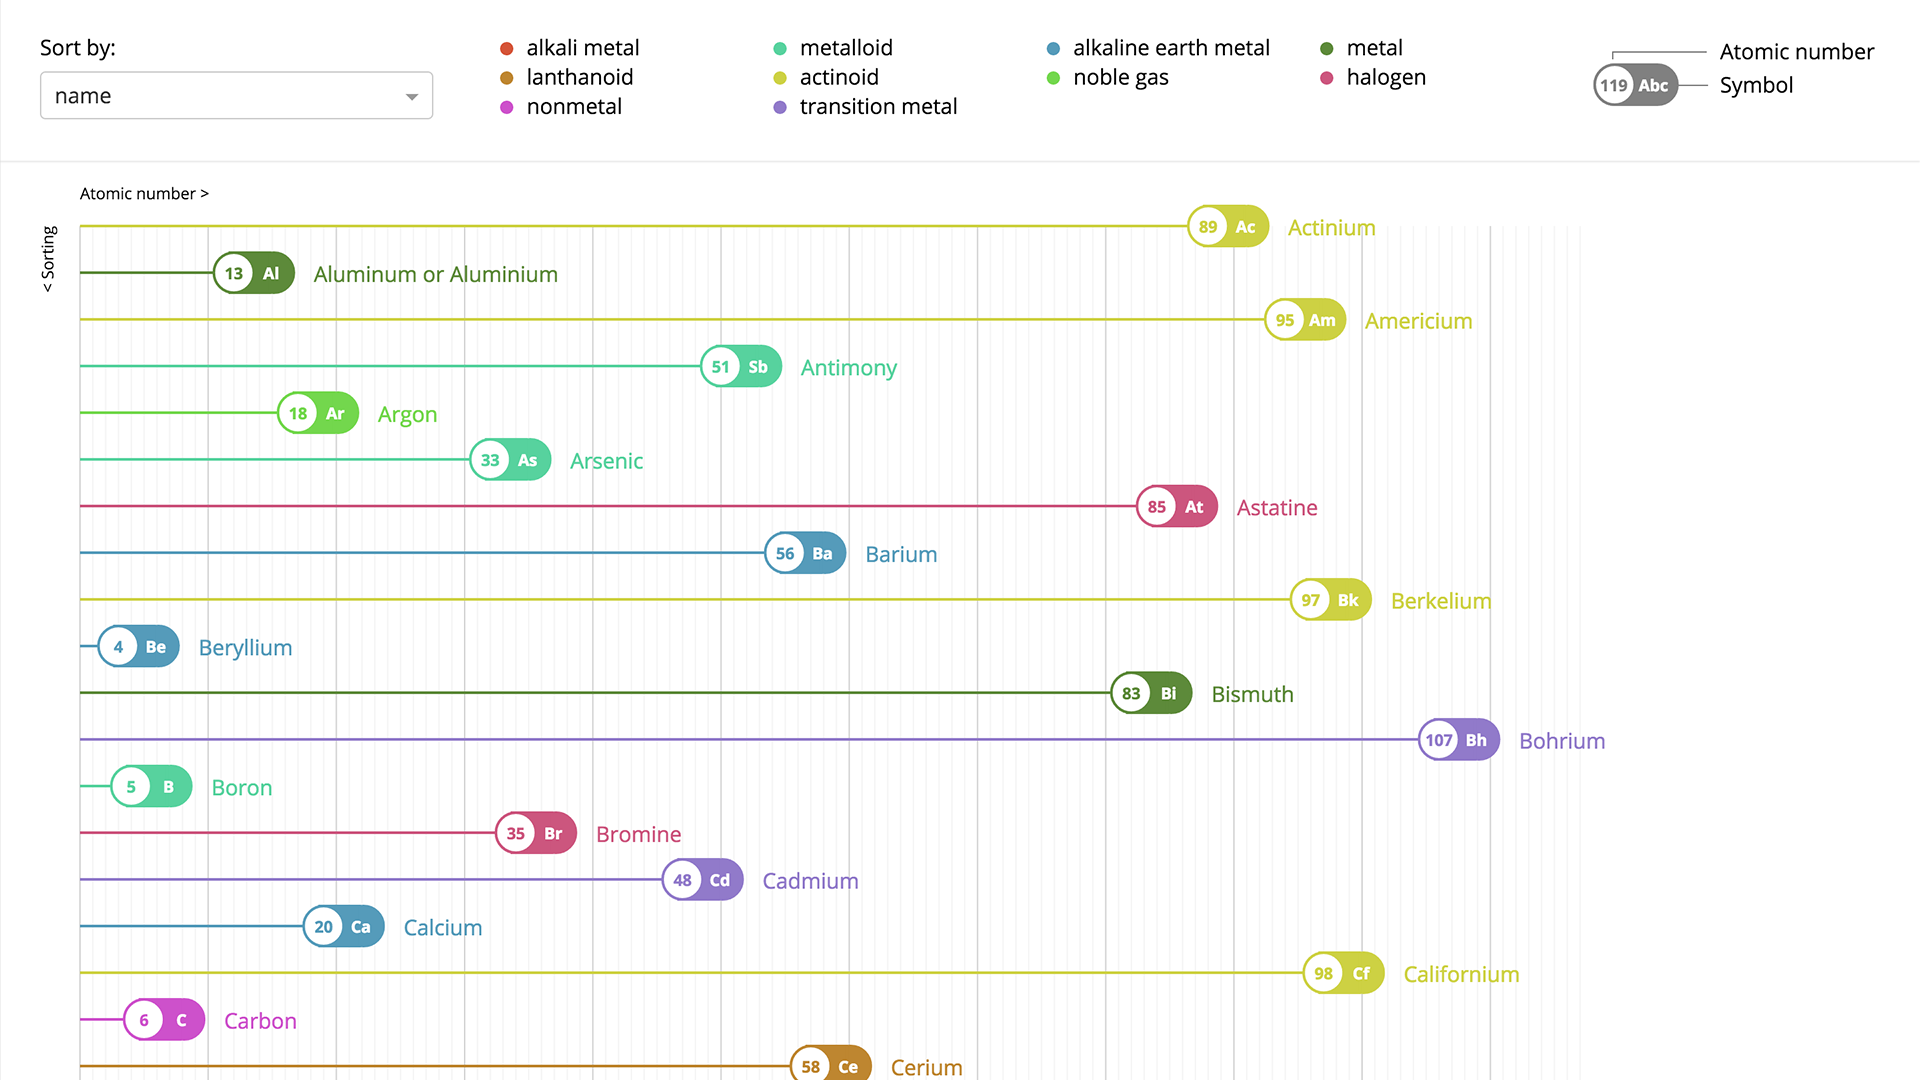
A different visual representation of the chemical elements of the periodic table.
The periodic table visualization is the result of an exercise done at the course “Input Output - Introduction to process-oriented design” supervised by Fabian Morón Zirfas.
git clone [email protected]:vogelino/periodic-table-data-visualization.git
cd periodic-table-data-visualization
npm install
Run npm start and open http://localhost:8080
