Ties pfSense with Suricata into ELK (Elasticsearch, logstash, and kibana) using docker-compose
Tested with Elasticsearch 6.3.0 and pfSense 2.4.3-RELEASE-p1 using docker for windows
The idea here is to use the plain docker images published by Docker@Elastic. We use the docker-compose.yml to specify the locations on disk to map, such as the data directory for elasticsearch and the config directories for logstash.
In the future, upgraging the version of elastic should be as easy as setting the environmental variables defined below.
Install Docker for Windows.
Download the pfsense-suricata-elk-docker repo contents.
Open a command prompt in the directory of the git repo.
Run the following commands to set the elastic version environment variables:
set ELASTIC_VERSION=6.3.0
set TAG=6.3.0
Edit the file docker-compose.yml, change the IP address 192.168.1.13 to the local IP that will be running docker (this PC). You'll notice both elastic and kibana use 127.0.0.1 and will only be available to the local machine while logstash will be available from your local network. You can update kibana to be available to your local network as well by updating it's IP address.
Stand up all the docker containers specified in the docker-compose.yml:
docker-compose up
At this point, windows firewall should have asked to you allow docker to open the port. Allow it.
Check out kibana at http://127.0.0.1:5601
Edit /config/logstash/pipeline/10-syslog.conf and change the host conditional on line 4 to be your pfSense IP address.
These changes will take effect when you restart logstash.
If you didn't get any docker errors, then awesome. Let's run it in detached mode now:
docker-compose up -d
Whenever you need to bring it down:
docker-compose down
You can also bring the services up individually:
docker-compose up logstash
Enable remote logging in the pfSense web UI by going to:
Status -> System Logs -> Settings
In Remote Logging Options, check "Enable Remote Logging", and add your remote Logstash server to the "Remote log servers". For example: 192.168.1.13:1514
Finally, check the "Everything" checkbox for "Remote Syslog Contents". Suricata won't log eve json unless "Everything" is chosen.
You may need to skim some of the entries in kibana to see if you got this right, as the source ip may not be your routers ip, due to running through docker. You can do this once pfSense is configured to log to LogStash. In kibana, under Dev Tools -> Console press the play button.
Enable Suricata logging to the syslog in pfSense web UI by going to:
Services -> Suricata -> Interfaces
Click the edit button for the interface you want logged.
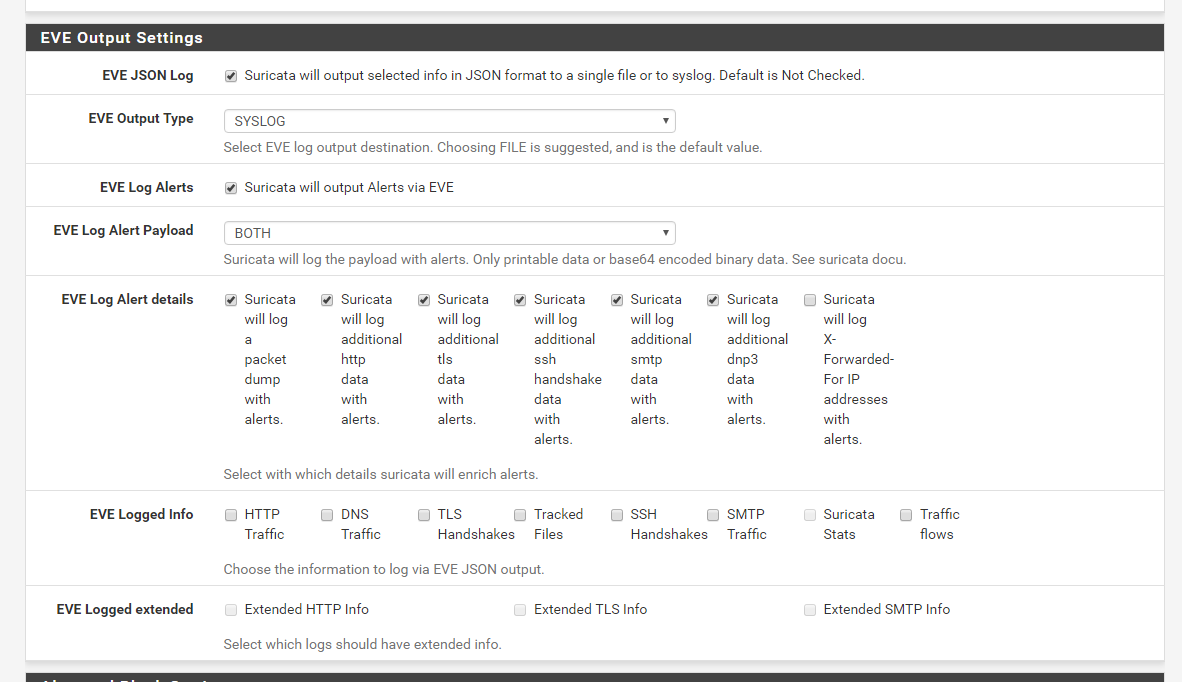
Under WAN Settings sroll down to EVE Output Settings
Copy these settings:
Click Save and restart the Suricata interface.
Import the kibana/visualizations.json and kibana/dashboard.json files. A easy google.
You may want to edit the filters in the kibana visualizations once you import them. I've filtered my lan interface out of the firewall logs to clean up some noise.
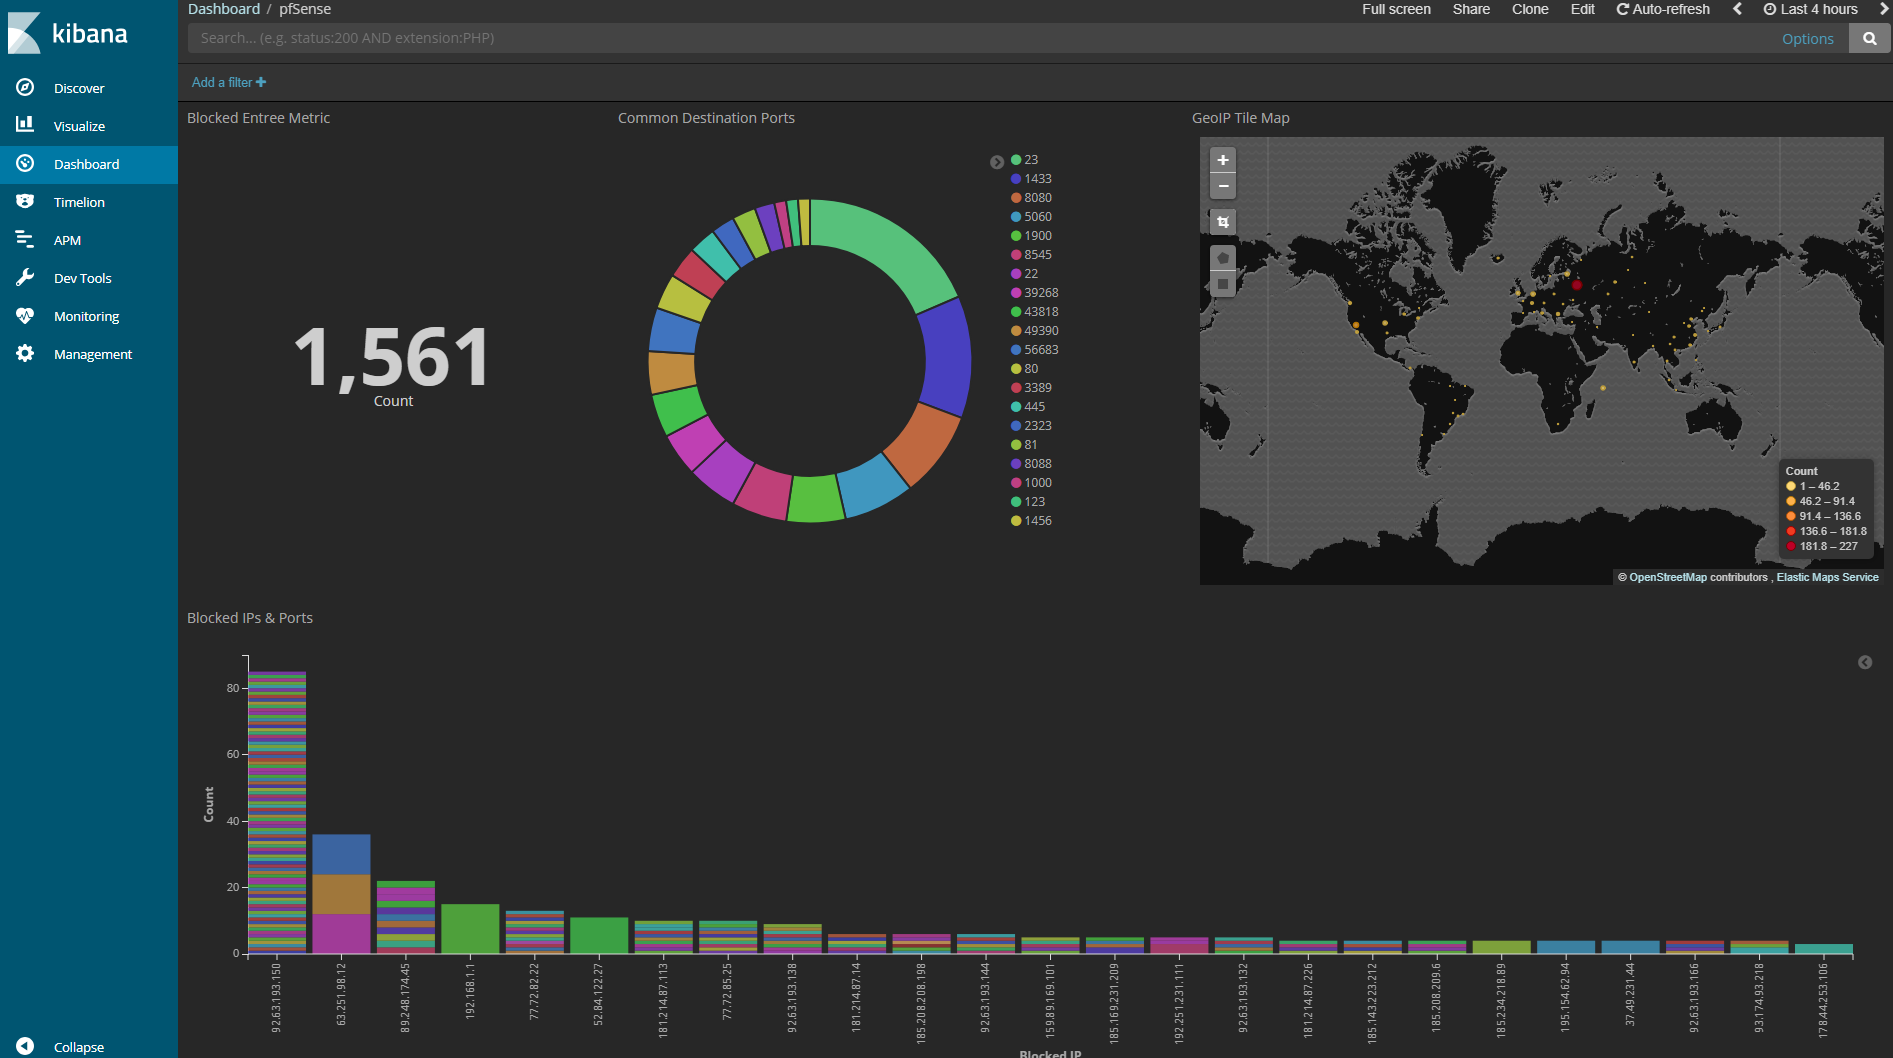
pfSense dashboard
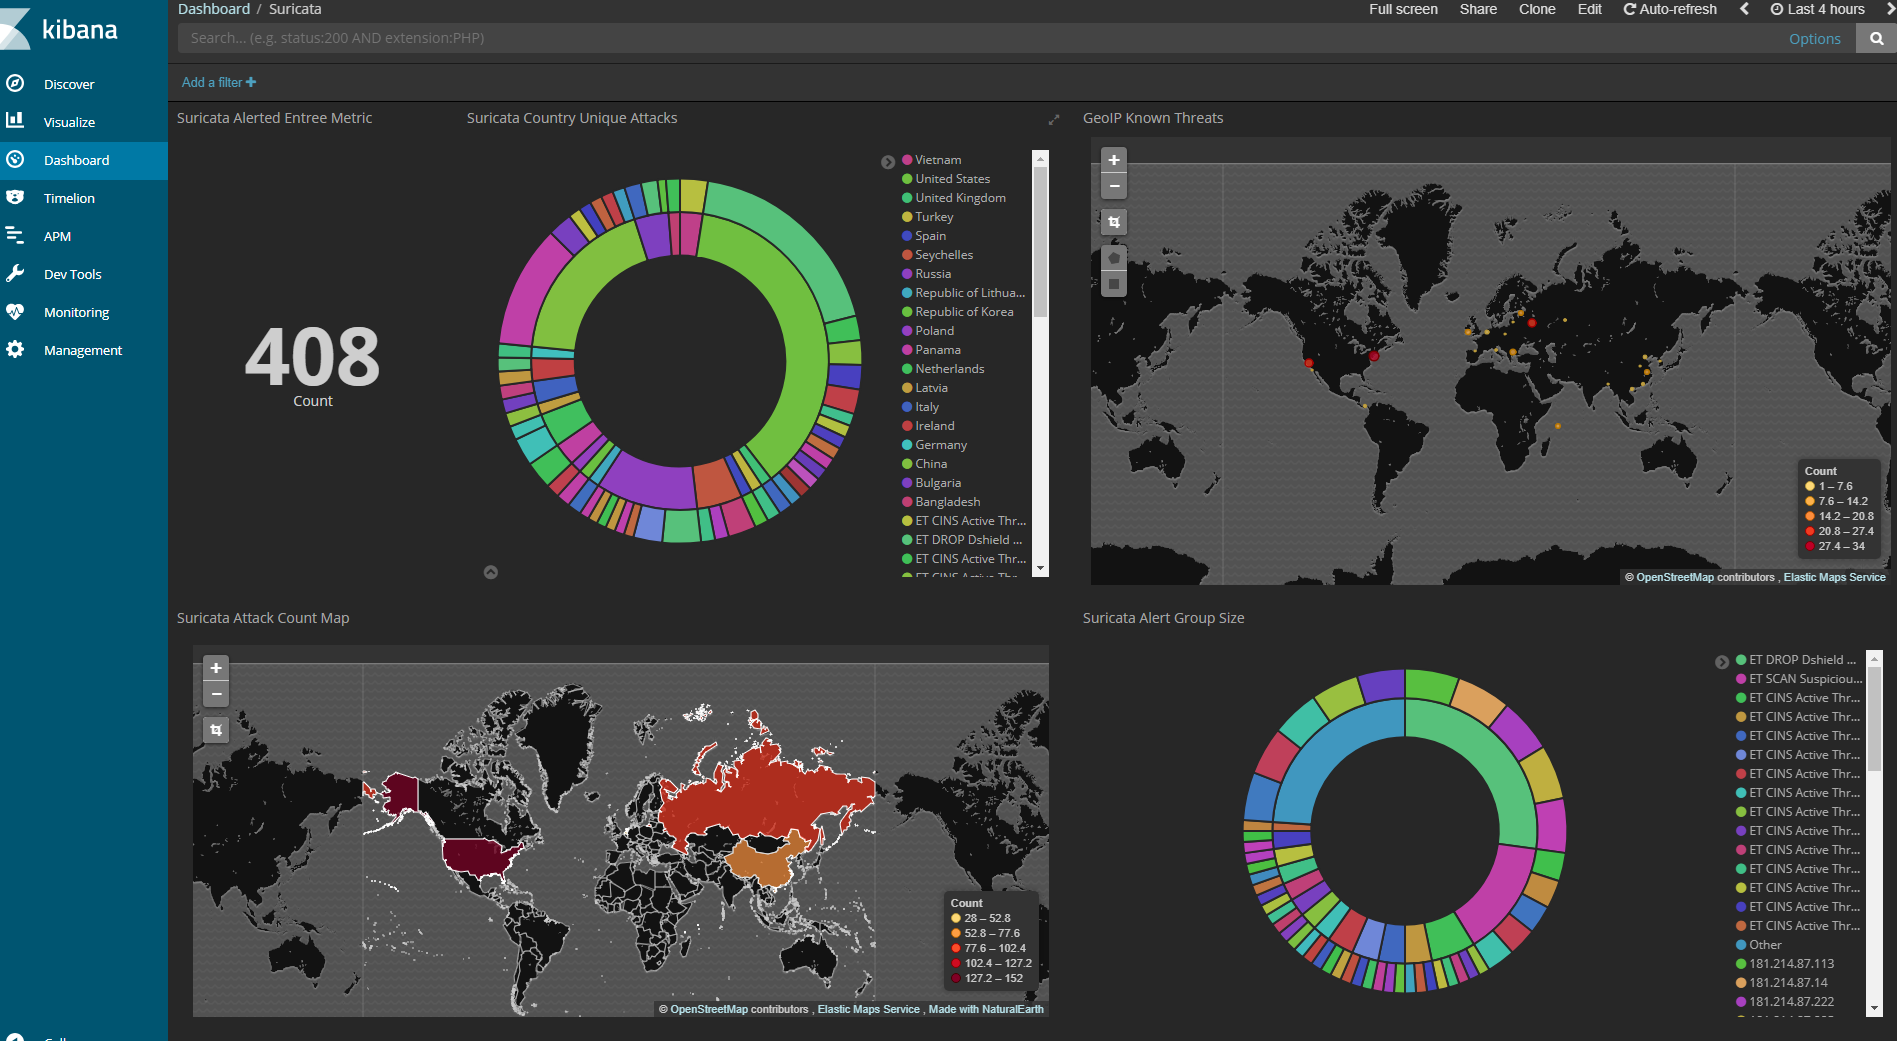
Suricata dashboard
Suricata seems to log both the eve json and it's regular output into the syslog.
Logstash has a parsing error, which I believe is related to the Suricata non-json logging. This doesn't stop it from logging, but future work could remove the error.
Some numeric data in elasticsearch appears to be logged as a string type, such as dest_port. Work can be done in the logstash configs to convert this to numeric to enable range queries in kibana.
https://www.docker.elastic.co/#
https://github.com/patrickjennings/logstash-pfsense
https://github.com/siemonster/suricata
https://github.com/elastic/stack-docker
https://gist.github.com/elijahpaul/3d80030ac3e8138848b5#file-pfsense2-2-grok
https://forum.netgate.com/topic/107735/elk-pfsense-2-3-working


