Simulating ADC background calibration algorithms in OpenCL
This repository contains code to simulate calibration algorithms based on the Independent Component Analysis (ICA) proposed in professor Yun Chiu's lab at UT Dallas. https://personal.utdallas.edu/~chiu.yun/index.html
Since the ICA-based methods generally require many (millions+) cycles to converge to an optimal solution, their simulation is cumbersome. Here, we rely on the OpenCL (through Python and pyOpenCL) framework to leverage these long simulations to a GPU. OpenCL (Open Computing Language) is a framework for writing programs that execute across heterogeneous platforms. OpenCL uses a specific version o C for programming these devices.
The repository contains 2 directories, namely amplifier and sar_ica that provide the OpenCL models and simulation scripts for the digital calibration of a nonlinear amplifier (see Y. Chiu, “Digital Adaptive Calibration of Data Converters Using Independent Component Analysis,” in Sampling Theory, A Renaissance, edited by G. Pfander, Springer-Birkhäuser, 2015, ISBN: 9783319197494 and W. Liu, P. Huang, and Y. Chiu, “A 12-bit 50-MS/s 3.3-mW SAR ADC with background digital calibration,” in IEEE Custom Integrated Circuits Conference, CICC’12, San Jose, CA, 2012 ) and a non-binary SAR ADC (see Y. Zhou and Y. Chiu, “Digital calibration of inter-stage nonlinear errors in pipelined SAR ADCs,” Analog Integrated Circuits and Signal Processing, Springer, special issue for MWSCAS’13, vol. 82, pp. 533-542, Mar. 2015).
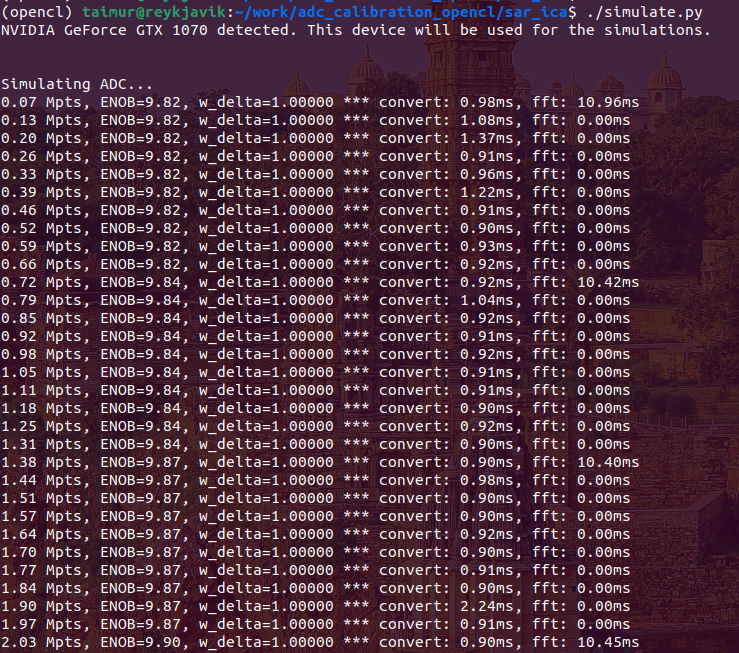
After cloning the repository, install the Python required packages, e.g. pip install -f requirements.txt. Also make sure you have all the OpenCL libraries and the ICD files for your platform installed in your system. Then go to the simulation directory (amplifier or sar_ica) and run the simulate.py script. If all goes well, you should see something like this
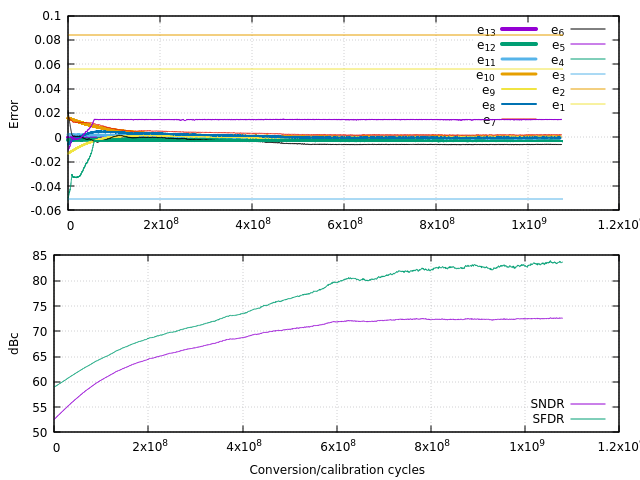
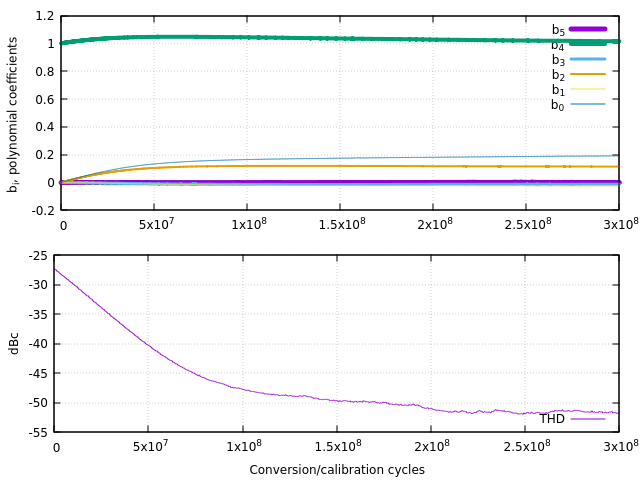
Notice that the effective number of bits (ENOB) is slowly increasing as the simulation runs. The simulation parameters can be changed inside simulate.py. You can also run the plot.sh script that is contained in the same folder to follow the results as the simulation progresses. Notice that gnuplot is required for this to work.


