The forna package provides a web interface for displaying RNA secondary
structures using the force-directed graph
layout provided by the
d3.js visualization library.
The front end makes use of Bootstrap and
Knockout.js for the user interfact while the back end
uses Flask to serve the static files and provide a
REST API. The RNA structure manipulation and graph construction is created
using the python forgi RNA
structure manipulation library and the provided forna.py script. We heavily
depend on the python bindings of the ViennaRNA package.
The server can be run locally on your machine. It depends on the forgi library and needs the ViennaRNA package installed with python bindings enabled (./configure --with-python).
Further, you need to downlaod the MC-Annotate program
and make it executeable by the server script.
To run it use the following command:
python forna_server.py -s -dDocumentation about the available options is provided using the -h option.
We provide the opportunity to add an RNA molecule from supported platforms using URL encoded queries. At the moment the ViennaRNA webservices and the RNAcentral database are supported as well as URL encoded data. Please contact us if you have suggestions for additional platforms.
To add a molecule using the RNAcentral-ID you can just call forna like this:
forna-domain/?id=RNAcentral/RNAcentral-ID
eg: http://nibiru.tbi.univie.ac.at/forna/forna.html?id=RNAcentral/URS0000000001
To include the data directly in the URL, two formats are available:
forna-domain/?id=fasta&file=fasta-file
eg: http://nibiru.tbi.univie.ac.at/forna/forna.html?id=fasta&file=>header\nAACGUUAGUU\n(((....)))
forna-domain/?id=url/molecule-name&sequence=sequence&structure=structure
eg: http://nibiru.tbi.univie.ac.at/forna/forna.html?id=url/name&sequence=AACGUUAGUU&structure=(((....)))
In the first case it's possible to input multiple molecules at once by having them all in a single string which is passed to the 'file' query. Note that in both cases the
structure is optional. If it's not provided, RNAfold will calculate and display the MFE structure.
For any platform it is also optionally possible to append a colors query using the custom color format:
forna-domain/?id=fasta&file=fasta-file&colors=custom-color-format
eg: http://nibiru.tbi.univie.ac.at/forna/forna.html?id=fasta&file=>header\nAACGUUAGUU\n(((....)))&colors=>header\nrange%3Dwhite:red\n0\n0.1\n0.2\n0.3\n0.4\n0.5\n0.6\n0.7\n0.8\n0.9\n1
Notice that the range part of the color parameter uses %3D to denote the '='. This is to prevent
it from being interpreted as its own argument.
This way it's also possible to embed forna on a website with a preloaded molecule.
<iframe src="forna/index.html?id=RNAcentral/URS0000000001" align="center" height="650px" width="100%"
seamless='seamless' frameBorder="0" AllowFullScreen></iframe>
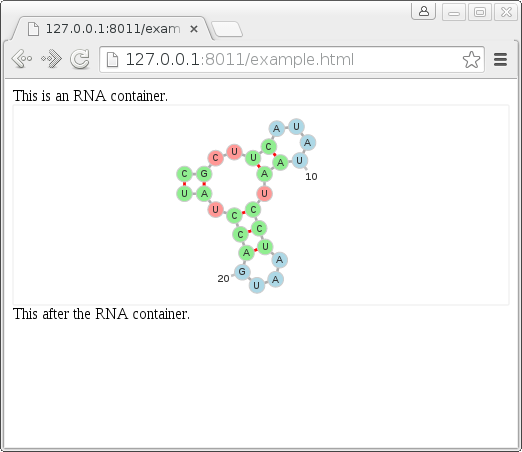
In many situations, the user interaction is superfluous and the desired goal is to simply display a secondary structure on a web page. This is a common scenario in, for example, servers that predict a secondary structure. The output, a dot-bracket string can simply be added to a FornaContainer object to display.
While the specifics are detailed in the online documentation,
the general pattern for use is shown in the example web page below:
<!DOCTYPE html>
<meta charset="utf-8">
<link rel="stylesheet" type="text/css" href="fornac.css" media="screen" />

This is an RNA container.
<div id='rna_ss'> </div>
This is after the RNA container.

    <script type='text/javascript' src='jquery.js'></script>
    <script type='text/javascript' src='d3.js'></script>
    <script type='text/javascript' src='fornac.js'></script>

    <script type='text/javascript'>
        var container = new FornaContainer("#rna_ss", {'applyForce': false});

        var options = {'structure': '((..((....)).(((....))).))',
                       'sequence':             'CGCUUCAUAUAAUCCUAAUGACCUAU'};

        container.addRNA(options.structure, options);
    </script>
The two key features are the creation of a div to contain the forna container and the javascript at the bottom which populates it with an RNA sequence, secondary structure and some optional parameters. The resulting web page can be seen in the screenshot below where a visualization of the RNA secondary structure appears without the need to first create a static image or call a java library.
Questions and/or comments can be sent to [email protected]
This work was funded by the Austrian DK RNA program FG748004, by the Austrian FWF, project "SFB F43 RNA regulation of the transcriptome," and the European Commission under the Environment Theme of the 7th Framework Program for Research and Technological Development (Grant agreement no: 323987).
