-
Notifications
You must be signed in to change notification settings - Fork 3
Capturing debug output
The widget supports printing debug messages that can help to troubleshoot problems with the widget. This messages can help you to find the reason of the problem (e.g. you may find a note that your PHP version is too old or the widget is installed in the wrong directory). Besides, this debug report is very important and should be attached if you can't solve the problem yourself and decide to create an issue and call for help.
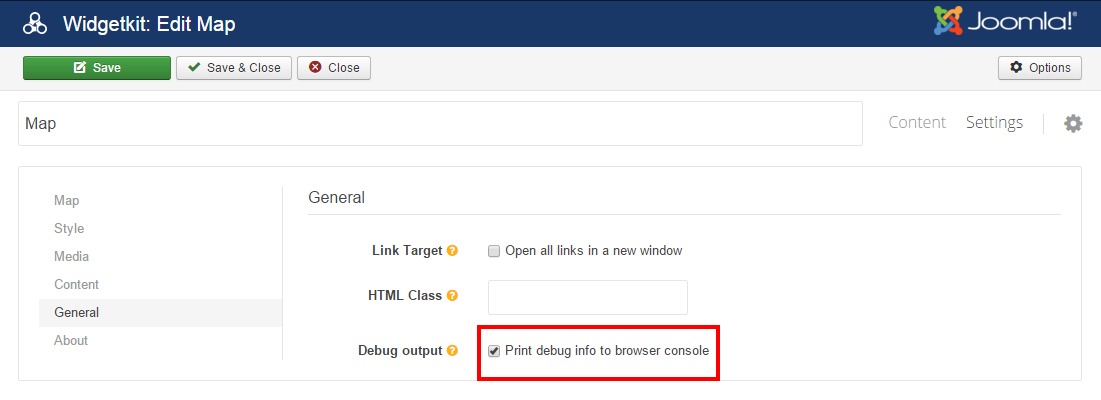
First of all you should activate the feature that prints debug messages (it's off by default). This option is located on the General tab of the widget's settings and is called "Debug Output":

The debug messages are printed using Javascript to the browser's console. When you access your website, you don't see them by default. First, you need to open a web page in your browser where the widget is located. Then you need to open your browser's console window in order to read these messages. Every browser has such console window that you can access through the menu of your browser. Sometimes such window is integrated into Web Page Inspector. Below are keyboard shortcuts for some browsers that open the console window. If your browser is not in the list and you can't find the console window in the menu of your browser, then you should use Google to find instructions how to access the window in your browser.
Press Ctrl + Shift + J (Windows / Linux) or Cmd + Opt + J (Mac).
Press Ctrl + Shift + K (Windows / Linux) or Cmd + Opt + K (Mac).
Press Ctrl + Shift + I. Then click on the "Console" tab.
Press F12 to open the developer tools. Then click on the "Console" tab.
Press Ctrl + Alt + I to open the Web Inspector. Then click on the "Console" tab.
You may see various messages in the debug window. These messages can be generated by different components, modules or plugins. All messages that belong to this widget start with a prefix [MapEx #ID], so that you can easily find and distinguish them among other messages. The ID is a CSS id generated dynamically (may be different every time you refresh your web page) and it's applied to the widget in HTML. This ID is used to distinguish messages from different widgets in case if more than one of them is rendered on the web page. If you need to make a relation between the widget and its ID, then you can open the HTML code of the page and find out what ID belongs to which widget.
Each message belongs to one of the following status levels:
- informational message (usually have blue color) show some generic statements about the widget and its behavior and environment.
- warning message (usually have yellow or orange color) show statements that require you attention. Such messages can help to solve a problem of unexpected behavior of the widget. However, if the widget works as expected, you can usually ignore this messages.
- error message (usually have red color) show errors that the widget detected or produced. If you see such messages, then the widget works incorrectly.
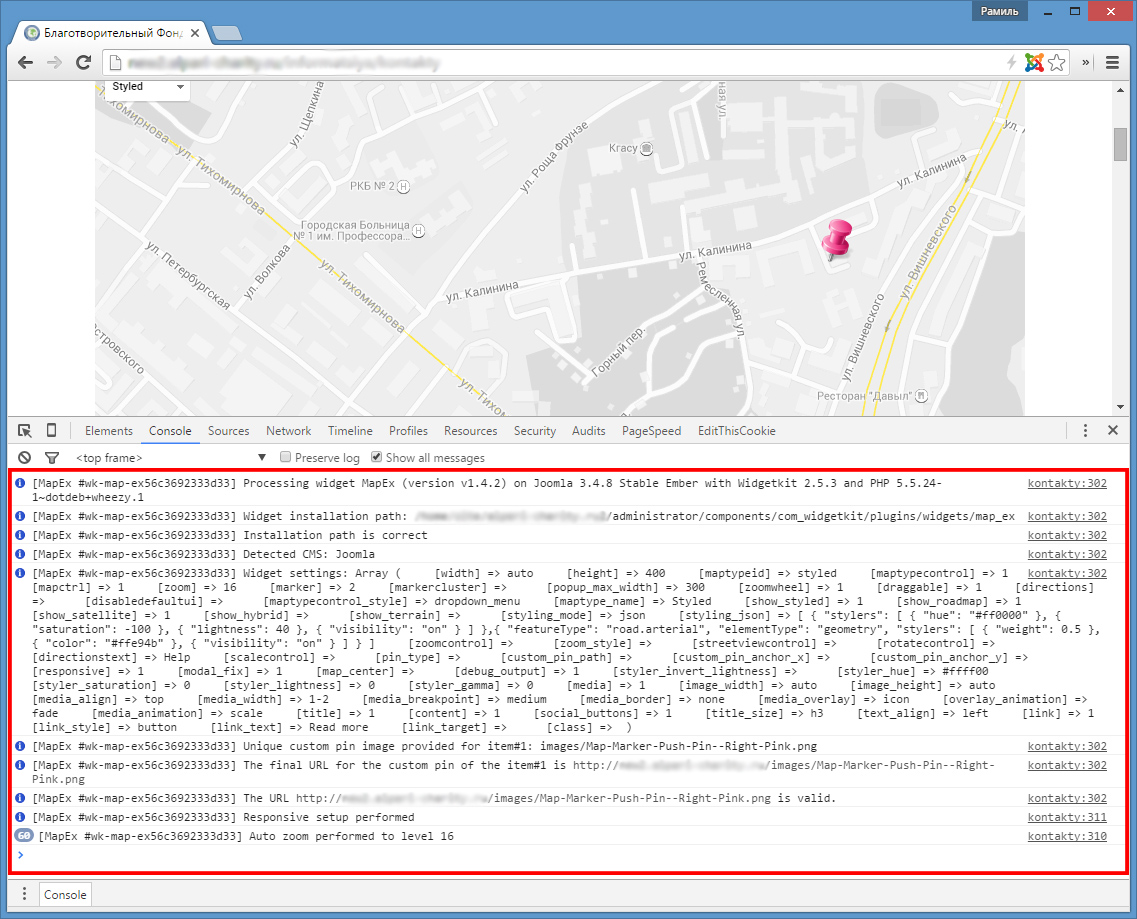
Warning and error messages have some explanations or instructions that you can follow in order to fix them. The following screenshot captured from Chrome browser (in other browsers it looks similar) shows a sample debug output on a web page with a single MapEx widget. The console output area is marked with red rectangle:

All the messages on the screenshot are informational, the widget works correctly, no warnings or errors detected.
In order to attach these messages to your report you can select them and copy to the clipboard and then paste into your message or issue.