-
Notifications
You must be signed in to change notification settings - Fork 58
Getting Crash Dumps on Ubuntu
When components of the Ubuntu desktop crash, we recommend following this guide to gather some additional debug info.
Step 1: Run sudo apt install apport-retrace to install a tool to augment the crash dumps
Step 2: Trigger the crash.
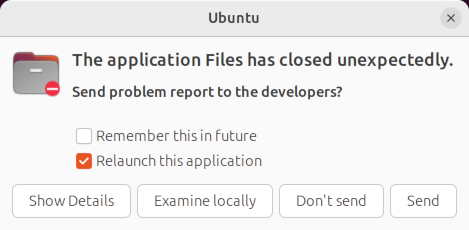
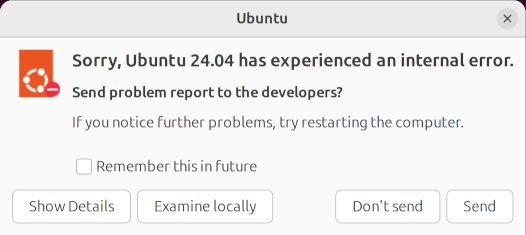
The system will automatically try to start the retrace tool after any crash. You should see a window similar to one of the following appear after a few seconds.


If the window never pops up, or the whole desktop crashed (which prevents the tool from being automatically started), you will need to manually run the tool:
- Run
ls -lt /var/crashto find the most recent crash dumps that have been saved - You should see a file with a timestamp from the moment the desktop crashed crashed. Make a note of the filename (it will likely start with
_usr_libexec_gnome-session-binary). - Run
apport-retrace /var/crash/<filename>
Step 3: If the "Relaunch this application" option is shown in the tool window, you can check or uncheck it as desired. Click the "Examine locally" button.
Step 4: Another window will pop up looking like the following. Make a note of the filename listed next to the "fully symbolic stack trace" option (e.g. /var/crash/_usr_bin_nautilus.1000.crash in this example).

Step 5: Select the "fully symbolic stack trace" option and then click "OK".
Step 6: After clicking OK, a terminal should pop up and start downloading debug symbols. This can take several minutes to complete. You may see a "not responding..." dialog appear for the retrace tool; you can ignore it as long as the terminal is continuing to download files.
Step 7: Eventually the terminal and tool window will both close without any other message.
Step 8: Run the command apport-unpack <crash-path> <extract-dir> with the file path from step 4 and the name of a directory to extract the crash dump into (the directory must be empty).
Step 9: Attach the <extract-dir>/Stacktrace file to an issue for us to review. This file contains a record of where the program was in its execution at the moment of the crash.
Step 10: Keep a copy of the <crash-path> file some place safe until the issue is resolved. It may contain additional info helpful for debugging. (The Stacktrace file is usually sufficient, much smaller, and generally free from sensitive data).
- Installing input-wacom from source
- Tips & Tricks
- Debugging
- Contributing