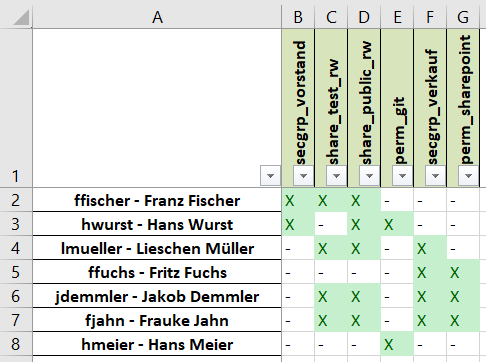
Script to export active directory user => group matrix to excel
With this python script you can query the active directory users and groups and create an matrix table where you can see which groups are assined to the users.
You will need the following python libaries:
- pandas
- xslxwriter
- ldap3
You must change the settings in the script to your needs:
# LDAP server ip or fqdn
LDAP_SERVER = '10.1.1.231'
# LDAP port 389 = unencrypted, 636 = encrypted
PORT = 389
# Use SSL? True/False
USE_SSL = False
# LDAP bind user DN
BIND = 'CN=ldap bind,CN=Users,DC=lab,DC=local'
# LDAP bind user password
BIND_PW = 'Test12345!'
# Base search DN
SEARCH = 'OU=lab,DC=lab,DC=local'
# All users regardless deactivated or activated
SEARCH_FILTER = '(&(objectclass=user)(sAMAccountName=*))'
# All users who are not deactivated
#SEARCH_FILTER = '(&(objectclass=user)(sAMAccountName=*)(!(UserAccountControl:1.2.840.113556.1.4.803:=2)))'
# All users who are not deactivated and in special group
#SEARCH_FILTER = '(&(objectclass=user)(sAMAccountName=*)(!(UserAccountControl:1.2.840.113556.1.4.803:=2))(memberOf=CN=b_testgruppe und restlicher DN))'
# Output file
FILE = 'output.xlsx'
- Nested groups not supported at the moment.
Have fun :-)
