Uses a genetic algorithm to create densely connected subnetworks of genes.
Input is two tab-delimited files named 'Input.gmt' and 'STRING.txt'. Input.gmt is a tab-delimited file formatted as Broad Institute’s Gene Matrix Transformed (GMT). STRING.txt is a version of the STRING database of known and predicted protein-protein interactions. Each line in the string file represents an edge in the network between the protein genes formatted protein'\t'protein'\t'weight'\n' where weight is the strength of their functional similarity.
Gene scores are calculated for each gene specified in the input file. Gene scores represent the relative connectedness each gene has to other genes in different loci. These scores are calculated by the number of edges a gene adds to a randomly generated prix fixe subnetwork and averaged for all subnetworks. A prix fixe subnetwork is a network with one gene from each loci.
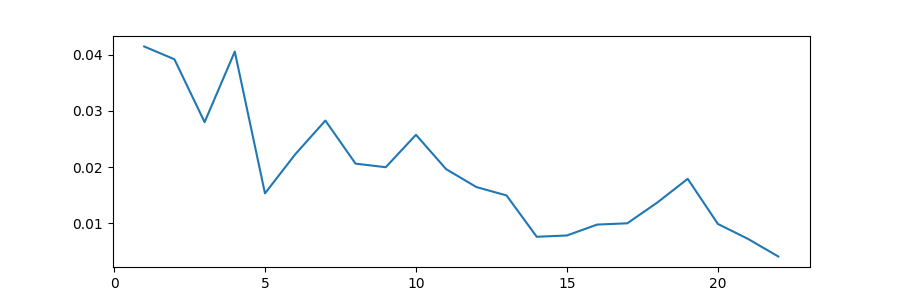
A genetic algorithm is used to create more densely connected subnetworks. The genetic algorithm was composed of two main parts, the mutation, and the mating step. Each subnetwork was mutated such that each gene had a 5% chance of being mutated. If mutated the new gene was chosen from the same loci as the original gene. During the mating step each network was mated with a different one, with networks with higher density being chosen with higher probability. Selection probability corresponds to edge weight such that each network had a chance of being chosen equal to the total edge weight multiplied by 10. I multiplied the edge weights by 10 because most of the edge weights were below 1 so this would give higher probability to the more connected graphs. In this way the degree of connectivity of the network is directly proportional to the probability of the network being picked. The genetic algorithm was stopped once the change from the previous to current edge density was less than 0.5%.
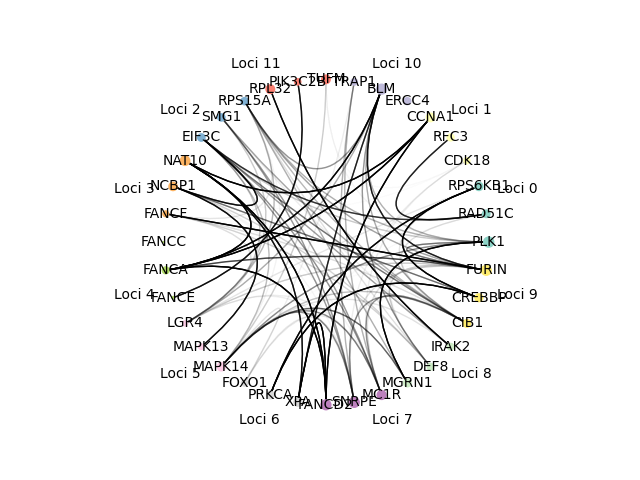
Networks can be visualized to show either the n genes with the highest gene scores or the n genes with the highest scores regardless of loci. They are visualized such that color represents loci of gene, size represents the gene score (bigger node means higher score), edges are from the STRING database with the darkness corresponding to the weight of the edge. The corresponding gene names, loci, gene scores from the visualized network are the output to a specified file.
- scipy
- matplotlib.pyplot
- operator
- functools
- networkx
- nxviz
import argparse, random, time
import networkCreation, fileParsing, statistics, geneScoring, networkVisualization, geneticAlgorithm, outputFiles

start = time.time()
random.seed(5)
visualize = True
genesFile = 'Input.gmt.txt'
interactionsFile = 'STRING.txt'
numSubnetworks = 5000
topGenes = False
numGenes = 5
calcPVal = True
numBins = 132

# read in networks
lociLists = fileParsing.readInput(genesFile)
interactions = fileParsing.makeInteractionNetwork(interactionsFile)
network = fileParsing.makeNetwork(lociLists, interactions)

# make loci subnetworks
lociSubN = networkCreation.makeLociSubnetworks(numSubnetworks, network, lociLists)

# calculate gene scores and sort genes by score
geneScores = geneScoring.getGeneScores(lociSubN, lociLists, network)
geneAvg = geneScoring.getGeneScoreAvg(geneScores)
networkSorted = sorted(geneAvg, key=lambda k: geneAvg[k], reverse=True)

newPop = geneticAlgorithm.geneticAlg(lociSubN, lociLists, network)


print(time.time() - start)

# get top numGenes from each loci
# make network with genes
if visualize:
    if not topGenes:
        genes = geneScoring.getTopLociGenes(geneAvg, lociLists, numGenes)
        visualNetwork = networkVisualization.makeCrossLociNetwork(genes, network, lociLists)

    # get top numGenes regardless of loci
    # make network with genes
    if topGenes:
        genes = networkSorted[:numGenes]
        visualNetwork = networkVisualization.makeCrossLociNetwork(genes, network, lociLists)

    # make graph with specified genes
    # 1. gene score - size of node
    # 2. loci of gene - color of node
    # 3. weight of edge - darkness of edge
    # make network between loci genes no edges between genes in same loci
    graph = networkVisualization.makeGraph(visualNetwork, lociLists, geneAvg)
    networkVisualization.visualizeGraph(graph, topGenes)

if calcPVal:
    numBins = numBins
    # make bins for coFunctional subnetwork creation
    qNetworkBins = networkCreation.makeQuantileBins(interactions, numBins)
    fNetworkBins = networkCreation.makeFixedBins(interactions, numBins)
    # make coFunctional random subnetworks
    # need 1000 populations where populations are the 5000 networks
    coFPopDensities = []
    for i in range(1000):
        coFSubnetworks = networkCreation.makeCoFSubnetworks(interactions, qNetworkBins, newPop)
        popD = 0

        for subCoF in coFSubnetworks:
            popD += statistics.calcEdgeDensityW(subCoF)
        coFPopDensities.append(popD/len(coFSubnetworks))

    # calculate the avg of each population -> makeCoFSubnetorks is one population?
    # calculate the pvalue
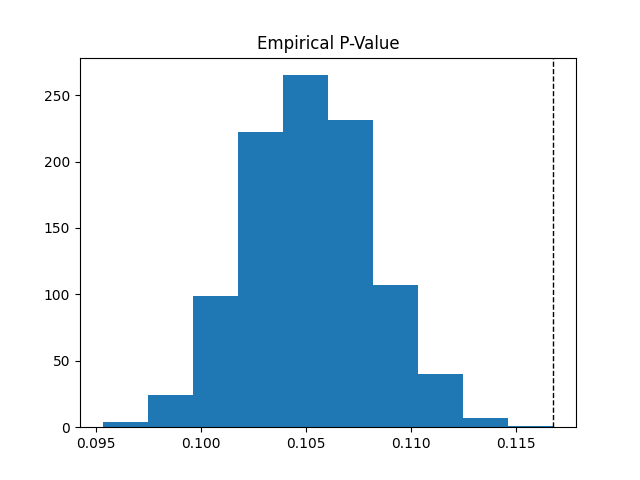
    # probability edges using cof distribution is greater than avg of loci edged divided by # of random networks

    pval = statistics.empiricalPVal(newPop, coFPopDensities)

    # make a graph showing the edge density distributions
    coFDensities = []
    for network in coFSubnetworks:
        coFDensities.append(statistics.calcEdgeDensityW(network))

    lociDensities = []
    for network in newPop:
        lociDensities.append(statistics.calcEdgeDensityW(network))

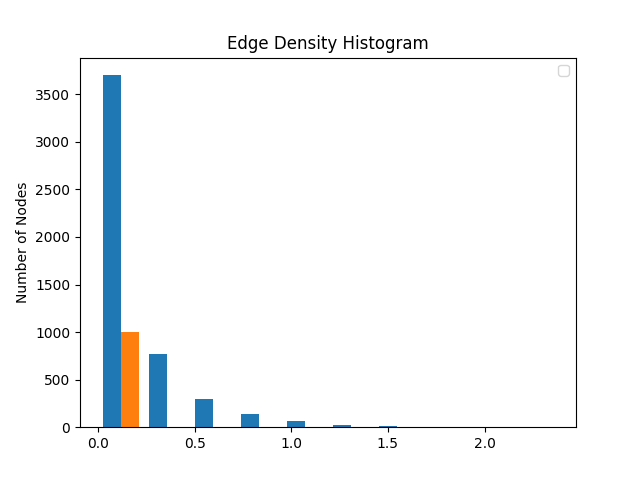
    statistics.overlappingHistogram(lociDensities, coFPopDensities)

    print('P-val : ', pval)
print(time.time() - start)
outputFiles.outputNetworks(2, newPop, 10)
outputFiles.outputGeneScoresinLoci(geneAvg, lociLists)$ python main.py yourInputFile.gmt.txt
$ python main.py input.gmt.txt --numSubnetworks=5000 --calcPVal=True
- Input.gmt
- disjoint gene sets
- tab-delimited file Input.gmt
- First two columns describe row of gene set
- format: (https://software.broadinstitute.org/cancer/software/gsea/wiki/index.php/Data_formats/)
- STRING.txt
- STRING database of known and predicted protein-protein interactions
- tab-delimited
- each line represents an edge in network between two genes
- weighted by strength of functional similarity
- Graph network visualization
- Colors correspond to gene loci
- Edge darkness corresponds to edge weight from STRING database
- Node size corresponds to gene score
- Tab Delimited File of genes, loci and corresponding gene scores
- gives the top genes from each loci or top genes regardless of loci
- Tab Delimited File of gene scores from each loci
- gives all genes in all loci
- Top Ten Networks
- tab delimited
- pval specified in file name
- genes and edges in network


