This repository, modified from the original repository, is about creating a centralized logging platform for your Docker containers, using ELK stack + Filebeat, which are also running on Docker.
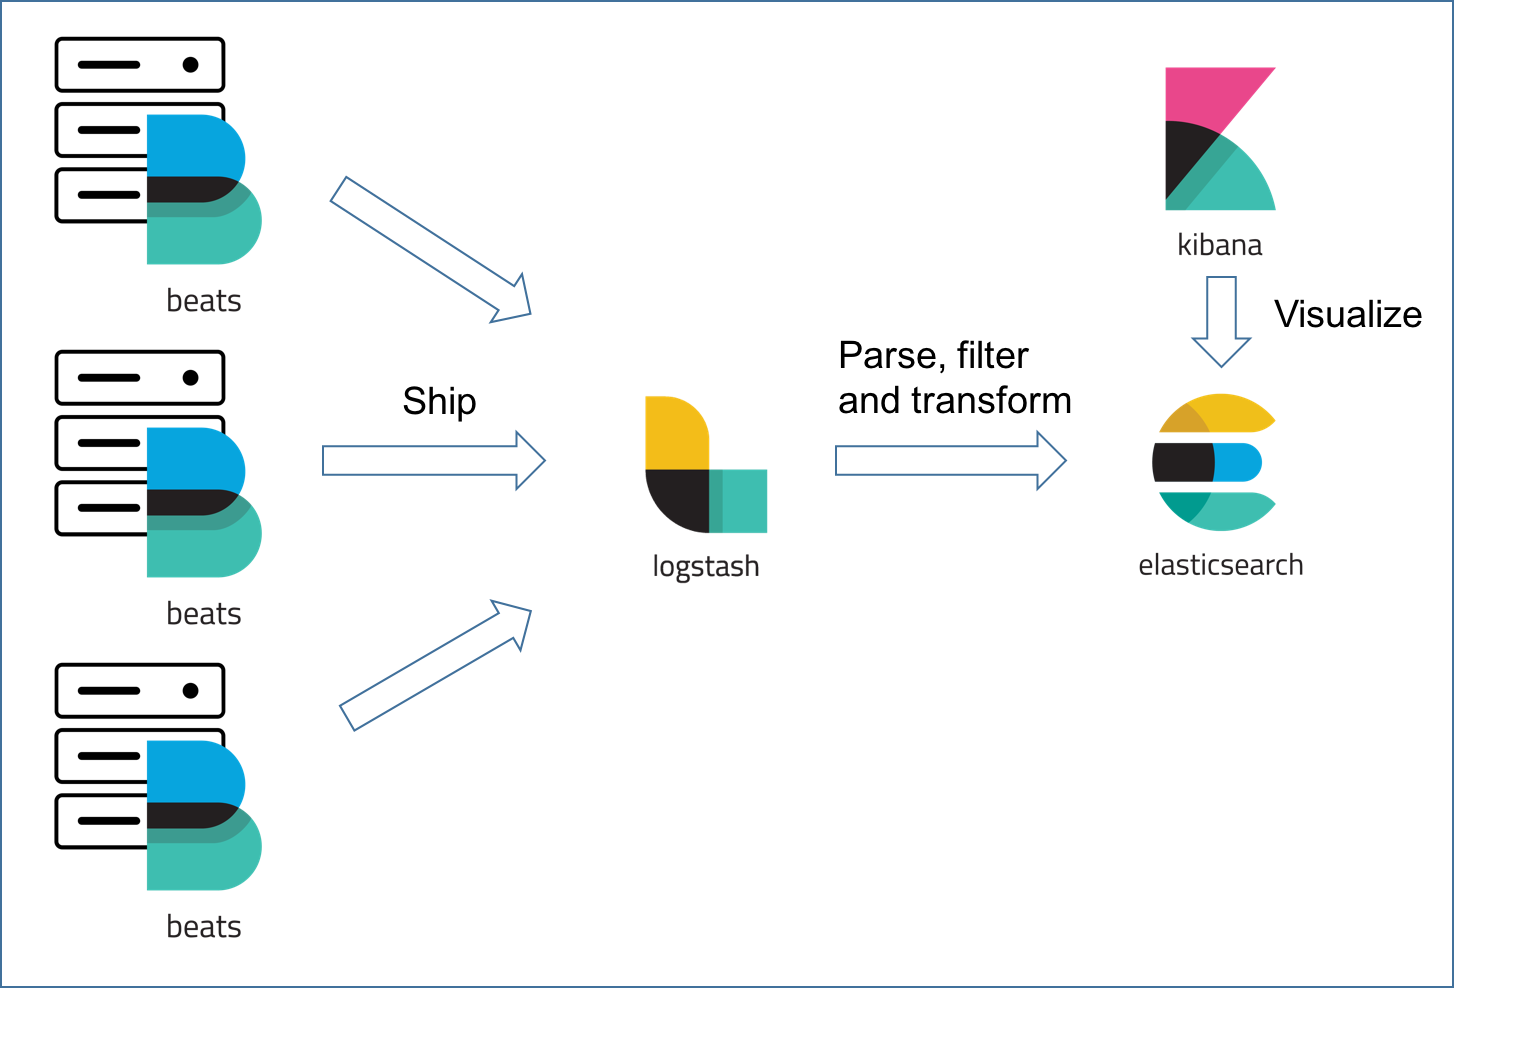
"ELK" is the acronym for three open source projects: Elasticsearch, Logstash, and Kibana. Elasticsearch is a search and analytics engine. Logstash is a server‑side data processing pipeline that ingests data from multiple sources simultaneously, transforms it, and then sends it to a "stash" like Elasticsearch. Kibana lets users visualize data with charts and graphs in Elasticsearch.
On top the ELK stack is Filebeat, a log shipper belonging to the Beats family — a group of lightweight shippers installed on hosts for shipping different kinds of data into the ELK Stack for analysis.
Based on the official Docker images from Elastic:
- Docker version 17.05+
- Docker Compose version 1.6.0+
- 1.5 GB of RAM
By default, the stack exposes the following ports:
- 5044: Logstash TCP input
- 9600: Logstash TCP input
- 9200: Elasticsearch HTTP
- 9300: Elasticsearch TCP transport
- 5601: Kibana
ℹ️ Elasticsearch's bootstrap checks were purposely disabled to facilitate the setup of the Elastic stack in development environments. For production setups, we recommend users to set up their host according to the instructions from the Elasticsearch documentation: Important System Configuration.
On distributions which have SELinux enabled out-of-the-box you will need to either re-context the files or set SELinux into Permissive mode in order for docker-elk to start properly. For example on Redhat and CentOS, the following will apply the proper context:
$ chcon -R system_u:object_r:admin_home_t:s0 docker-elk/Ensure the Shared Drives feature is enabled for the C: drive.
The default Docker for Mac configuration allows mounting files from /Users/, /Volumes/, /private/, and /tmp
exclusively. Make sure the repository is cloned in one of those locations or follow the instructions from the
documentation to add more locations.
In dev/test environment, ELK stack and Filbeat can run separately using docker-compose upand do not need to share a bridge or overlay network; however, Filebeat needs to be able to connect to the host of ELK.
In production environment, it is recommended to run ELK + Filebeat as ONE stack in a Docker Swarm.
Clone this repository to the server on which the stack will be running.
To start the ELK stack using Docker Compose:
$ cd elk
$ docker-compose upClone this repository to the server from which you like to ship logs to ELK stack.
First, in filebeat/filebeat.yml file, you MUST replace <logstash server IP> with the IP address your ELK stack is running on.
Then, run the Filebeat as docker:
$ cd filebeat
$ docker-compose up
By default, all container logs of the server on which the Filbeat container is running will be shipped to Logstash container for processing.
You can also run all services in the background (detached mode) by adding the -d flag to the above command.
ℹ️ You must run
docker-compose buildfirst whenever you switch branch or update a base image.
If you are starting the stack for the very first time, please read the section below attentively.
ℹ️ Refer to How to disable paid features to disable authentication.
The stack is pre-configured with the following privileged bootstrap user:
- user: elastic
- password: changeme
Although all stack components work out-of-the-box with this user, we strongly recommend using the unprivileged built-in users instead for increased security. Passwords for these users must be initialized:
$ docker-compose exec -T elasticsearch bin/elasticsearch-setup-passwords auto --batchPasswords for all 6 built-in users will be randomly generated. Take note of them and replace the elastic username with
kibana and logstash_system inside the Kibana and Logstash configuration files respectively. See the
Configuration section below.
ℹ️ Do not use the
logstash_systemuser inside the Logstash pipeline file, it does not have sufficient permissions to create indices. Follow the instructions at Configuring Security in Logstash to create a user with suitable roles.
Restart Kibana and Logstash to apply the passwords you just wrote to the configuration files.
$ docker-compose restart kibana logstashℹ️ Learn more about the security of the Elastic stack at Tutorial: Getting started with security.
Give Kibana about a minute to initialize, then access the Kibana web UI by hitting http://localhost:5601 or http://<docker host IP>:5601 with a web browser and use the following default credentials to log in:
- user: elastic
- password: <your generated elastic password>
When Kibana launches for the first time, it is not configured with any index pattern.
ℹ️ You need to inject data into Logstash before being able to configure a Logstash index pattern via the Kibana web UI. Then all you have to do is hit the Create button.
Refer to Connect Kibana with Elasticsearch for detailed instructions about the index pattern configuration.
Create an index pattern via the Kibana API:
$ curl -XPOST -D- 'http://localhost:5601/api/saved_objects/index-pattern' \
    -H 'Content-Type: application/json' \
    -H 'kbn-version: 7.2.1' \
    -u elastic:<your generated elastic password> \
    -d '{"attributes":{"title":"logstash-*","timeFieldName":"@timestamp"}}'
The created pattern will automatically be marked as the default index pattern as soon as the Kibana UI is opened for the first time.
To be added...
My idea to persist the logs:
- Run a cron job that constantly copies container logs to a dedicated location like
/data, so that even when the containers are removed along with the original copies of their logs, we still have access to their logs for debugging and other purposes. - Configure the filebeat containers to fetch the logs from the dedicated location.
ℹ️ Configuration is not dynamically reloaded, you will need to restart individual components after any configuration change.
The Elasticsearch configuration is stored in elasticsearch.yml.
You can also specify the options you want to override by setting environment variables inside the Compose file:
elasticsearch:

  environment:
    network.host: _non_loopback_
    cluster.name: my-cluster
Please refer to the following documentation page for more details about how to configure Elasticsearch inside Docker containers: Install Elasticsearch with Docker.
The Kibana default configuration is stored in kibana.yml.
It is also possible to map the entire config directory instead of a single file.
Please refer to the following documentation page for more details about how to configure Kibana inside Docker containers: Running Kibana on Docker.
The Logstash configuration is stored in logstash.yml.
It is also possible to map the entire config directory instead of a single file, however you must be aware that
Logstash will be expecting a log4j2.properties file for its own logging.
Please refer to the following documentation page for more details about how to configure Logstash inside Docker containers: Configuring Logstash for Docker.
The Filebeat configuration is stored in filebeat.yml
By default, it takes all the containers' logs on its host as the input:
filebeat.inputs:
   - type: container
     paths:
        - '/var/lib/docker/containers/*/*.log'
And output to Logstash:
output.logstash:
   hosts: ["<logstash server IP>:5044"]
Please refer to the following documentation page for more details about how to configure Filebeat to take container logs as the input: Container Input, or how to run Filebeat as a container: Running Filebeat on Docker.
Switch the value of Elasticsearch's xpack.license.self_generated.type option from trial to basic (see License
settings).
Follow the instructions from the Wiki: Scaling out Elasticsearch
The data stored in Elasticsearch will be persisted after container reboot but not after container removal.
In order to persist Elasticsearch data even after removing the Elasticsearch container, you'll have to mount a volume on
your Docker host. Update the elasticsearch service declaration to:
elasticsearch:

  volumes:
    - /path/to/storage:/usr/share/elasticsearch/data
This will store Elasticsearch data inside /path/to/storage.
ℹ️ (Linux users) Beware that the Elasticsearch process runs as the unprivileged
elasticsearchuser is used within the Elasticsearch image, therefore the mounted data directory must be writable by the uid1000.
By default, both Elasticsearch and Logstash start with 1/4 of the total host memory allocated to the JVM Heap Size.
The startup scripts for Elasticsearch and Logstash can append extra JVM options from the value of an environment variable, allowing the user to adjust the amount of memory that can be used by each component:
| Service | Environment variable |
|---|---|
| Elasticsearch | ES_JAVA_OPTS |
| Logstash | LS_JAVA_OPTS |
To accomodate environments where memory is scarce (Docker for Mac has only 2 GB available by default), the Heap Size
allocation is capped by default to 256MB per service in the docker-compose.yml file. If you want to override the
default JVM configuration, edit the matching environment variable(s) in the docker-compose.yml file.
For example, to increase the maximum JVM Heap Size for Logstash:
logstash:

  environment:
LS_JAVA_OPTS: -Xmx1g -Xms1gAs for the Java Heap memory (see above), you can specify JVM options to enable JMX and map the JMX port on the Docker host.
Update the {ES,LS}_JAVA_OPTS environment variable with the following content (I've mapped the JMX service on the port
18080, you can change that). Do not forget to update the -Djava.rmi.server.hostname option with the IP address of your
Docker host (replace DOCKER_HOST_IP):
logstash:

  environment:
LS_JAVA_OPTS: -Dcom.sun.management.jmxremote -Dcom.sun.management.jmxremote.ssl=false -Dcom.sun.management.jmxremote.authenticate=false -Dcom.sun.management.jmxremote.port=18080 -Dcom.sun.management.jmxremote.rmi.port=18080 -Djava.rmi.server.hostname=DOCKER_HOST_IP -Dcom.sun.management.jmxremote.local.only=falseTo use a different Elastic Stack version than the one currently available in the repository, simply change the version
number inside the .env file, and rebuild the stack with:
$ docker-compose build
$ docker-compose up
ℹ️ Always pay attention to the upgrade instructions for each individual component before performing a stack upgrade.
Experimental support for Docker Swarm mode is provided in the form of a docker-stack.yml file, which can
be deployed in an existing Swarm cluster using the following command:
$ docker stack deploy -c docker-stack.yml elkIf all components get deployed without any error, the following command will show 3 running services:
$ docker stack services elkℹ️ To scale Elasticsearch in Swarm mode, configure zen to use the DNS name
tasks.elasticsearchinstead ofelasticsearch.