Frugal Camera Based Microplate Reader
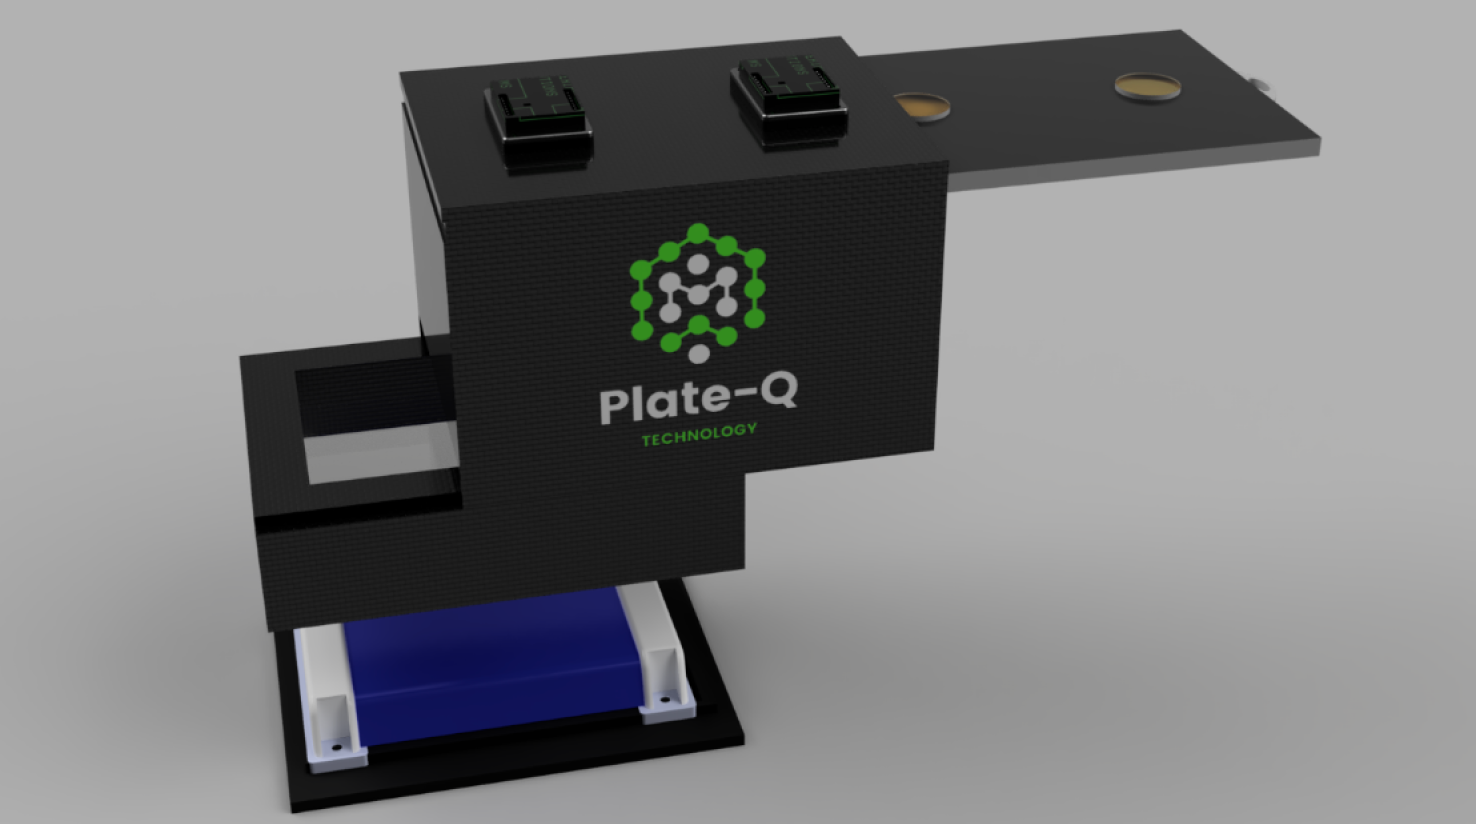
In typical labs, Plate Readers are very helpful in quantifying green fluorescence protein (GFP) and Optical Density (OD) from a 96-well standard plate; however, laboratory grade plate readers can cost up to $15,000 which is cost prohibitive for underfunded labs. To address this issue, we worked with Dr. Bhamla at the Georgia Institute of Technology and his colleague Chinna Devarapu at Tyndall National Institute to create Plate-Q, a frugal microplate reader. At just under $150, Plate-Q is an inexpensive way to quantify both fluorescence and optical density (OD) of samples. Rather than using optical sensors found in laboratory grade plate readers[6], Plate-Q takes advantage of a Raspberry Pi camera to capture images of a well plate and extracts image features using computer vision and machine learning algorithms. A 440 nm wavelength excitation light is used to measure GFP fluorescence using a 510 nm filter for emission, and a 600 nm light source is used for OD without any emission filter. Plate-Q is completely open-source and users can customize the design to scan for other fluorescent proteins by replacing the light source and filter for different wavelengths. Users can retrain the Plate-Q algorithm to take measurements in an affordable and sustainable manner.
- Frosted Acrylic Plate
- Raspberry Pi
- Raspberry Pi HQ Camera with 16mm Lens
- 440 nm LED Strip Lights
- 600 nm LED Strip Lights
- 510 nm Glass emission filter
Users are able to retain the CAD files by accesing the STL folder in the github repository.
Folders
- Camera Case: contains all of the files for the camera case
- Plate Reader Design: contains all of the files for Plate-Q
- Well Plate Cover:Contains all of the files for the well plate cover
Plate-Q relies on a standardized Raspberry Pi HQ camera for the quantification of fluorescence and optical density, which is done through a software pipeline (Figure 14-15) that extracts the image features and maps those values to laboratory-grade plate reader values. The pipeline starts by taking pictures in triplicates at 4 different positions across the well plate. Each image is then converted into a grayscale and applied a perspective transformation to analyze the perceived brightness. Then to isolate the wells in the image Otsu's Thresholding (see Image optimization) is used. Then a gamma correction is applied to the image to ecode it into a linear luminescence scale. Finally the brightness values of the triplicates are extracted and averaged to eliminate any outliers. Then the final value is stored in a data frame (CSV file) that is passed through a mathematical regression model to output laboratory-grade plate reader values.
Learn More Here: Plate-Q Preprint
Users are able to retain the code files in the github repository.
Folders
- Demonstration Notebook: contains Jupyter Notebook With Visual
- takePicture.py: Python Script to take picture of sample with proper camera settings
- Main.py: Main Python File To Calculate Fluorescence or Optical Density
Plate-Q is run on a Rasperry Pi System. The following steps explain how to download the repository and run the python scripts
- Open Terminal and navigate to folder of intrest
- Run the Following Command in terminal to download Main Files:
wget https://github.com/igemsoftware2021/Lambert_GA/blob/main/Main/Main.py
wget https://github.com/igemsoftware2021/Lambert_GA/blob/main/Main/takePicture.py
- Now making sure you are in the proper folder run the takingpitcure.py file by running following command in terminal:
python takePicture.py
- Now Taking the output from the python file above run the following command to run the Main.py file:
python Main.py
- Follow the propted steps by the command line and emjoy the flourecence/od output
Team: Lambert Highschool

