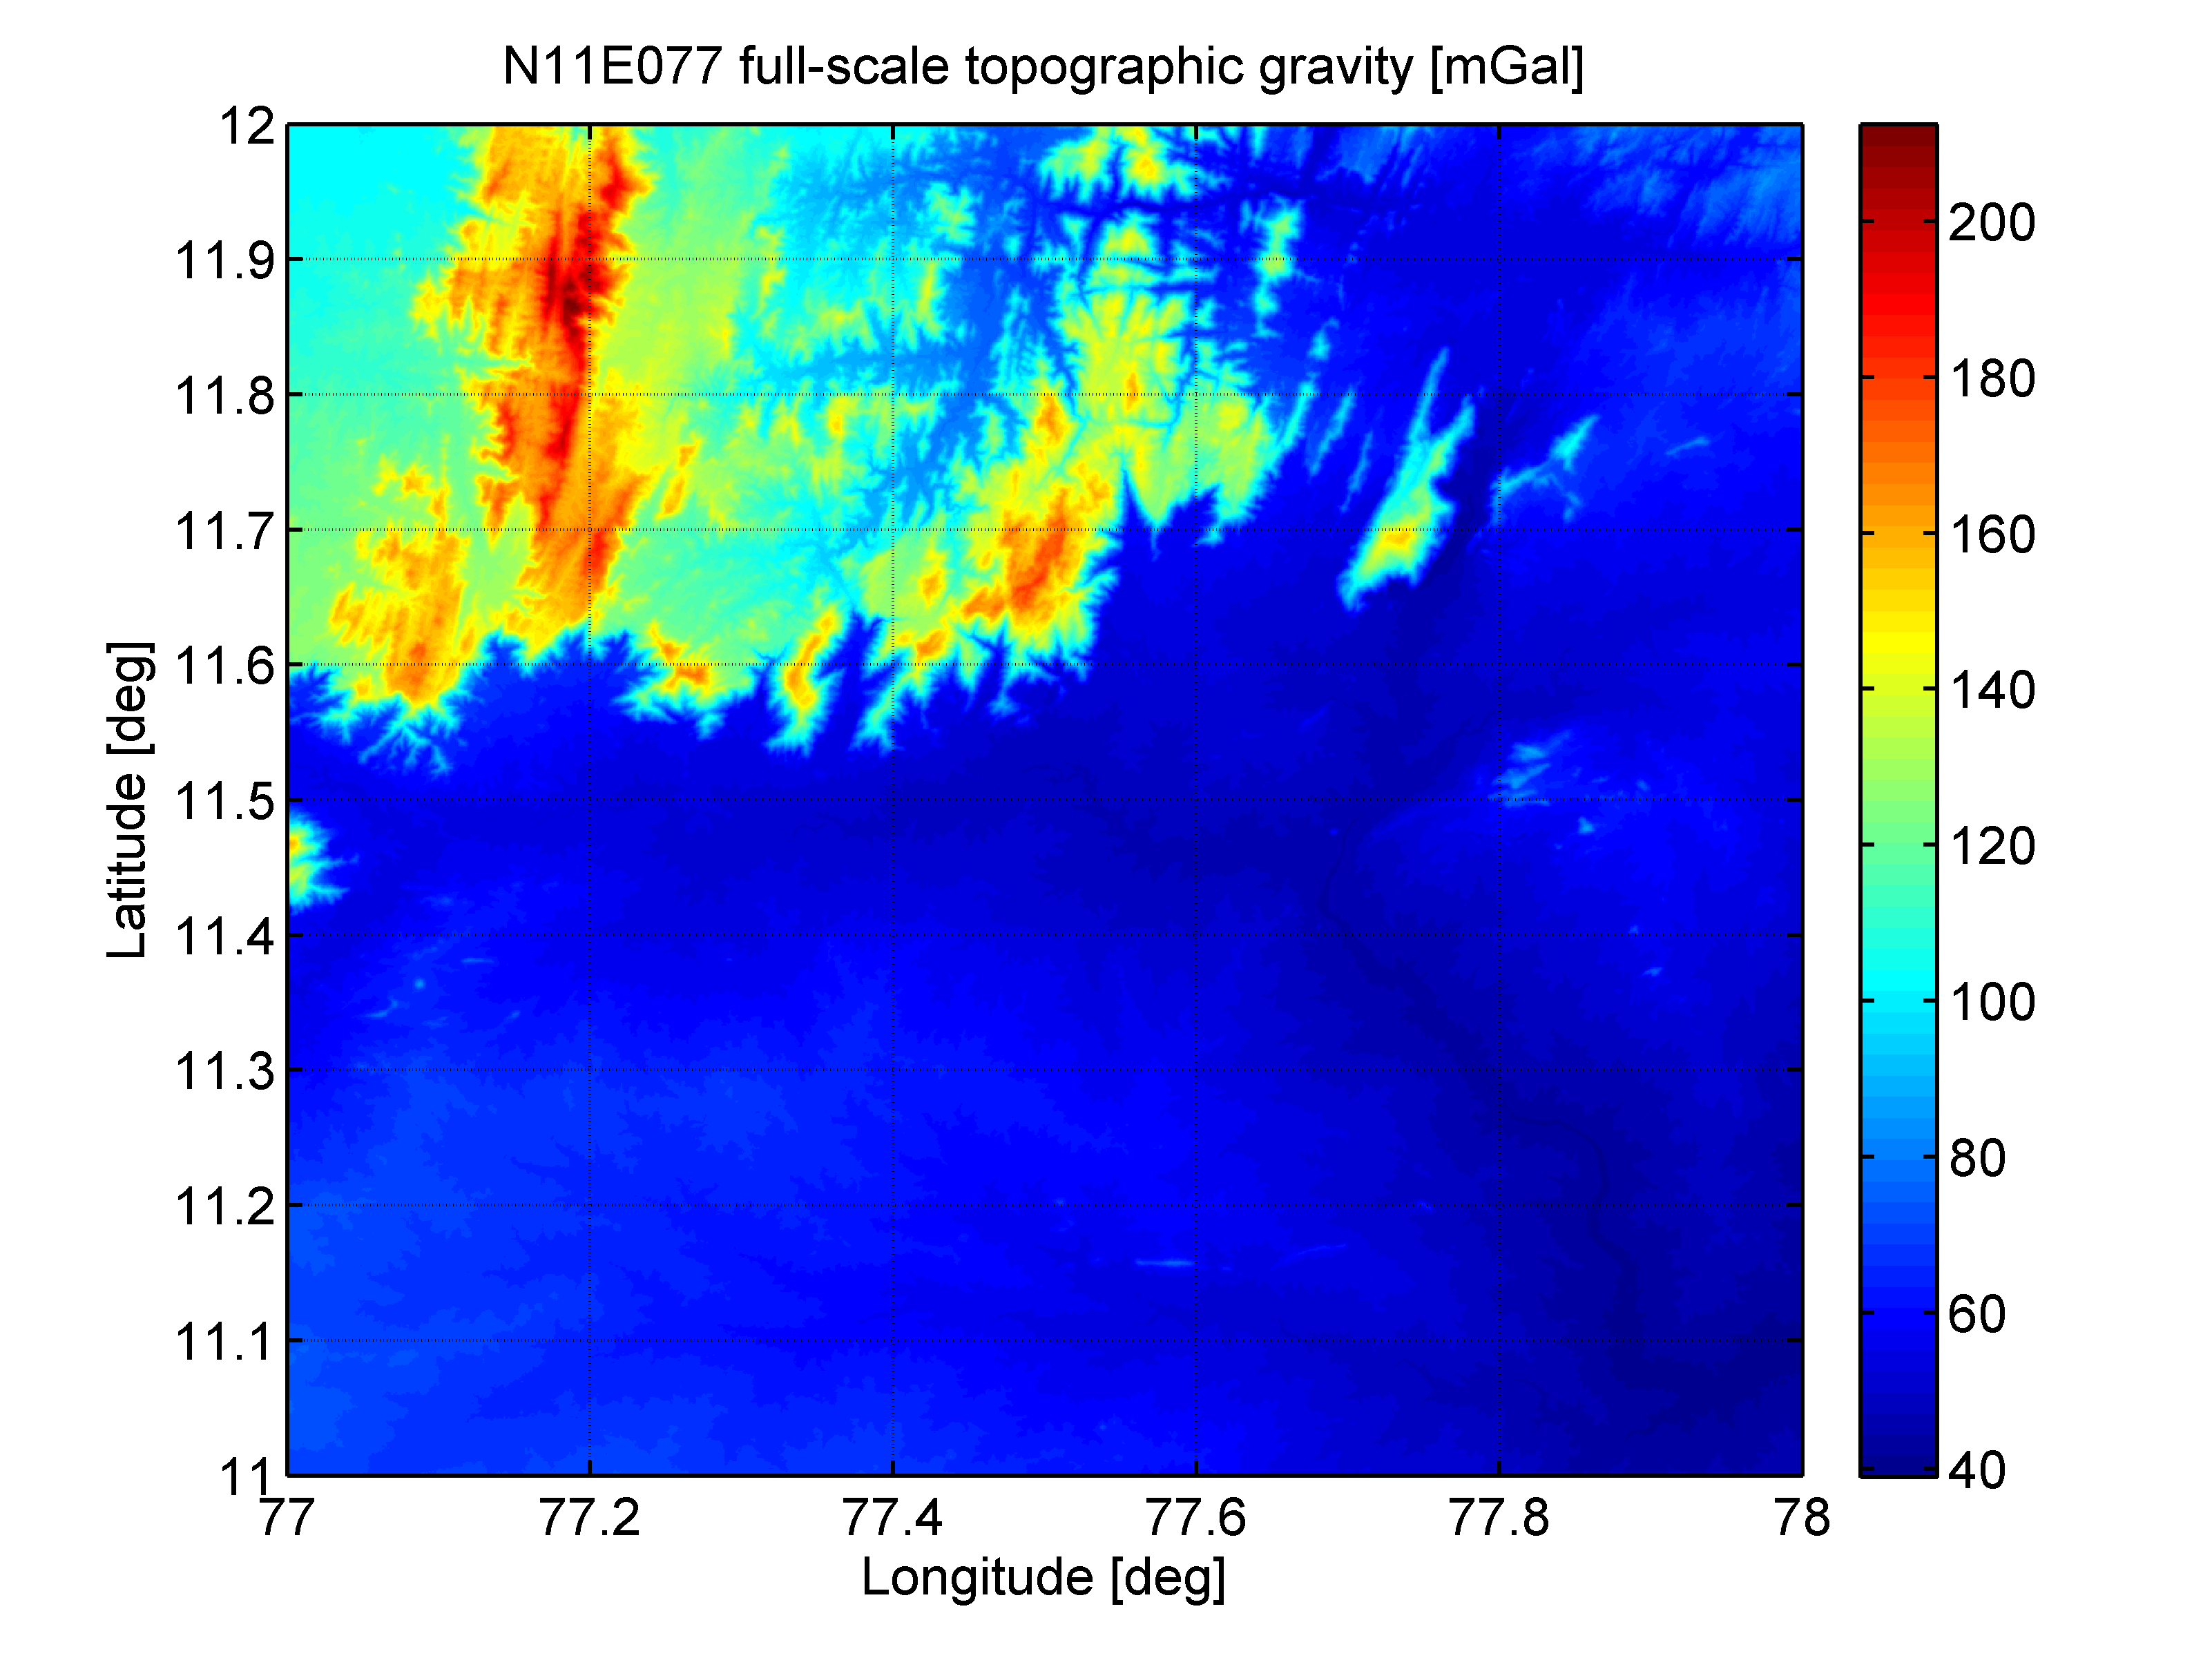
This work seeks to visualize the work done by Hirt et al. (2019). The Readme for their research is here.
This project initially started by perusing the GRACE Tellus Gravity Recovery & Climate Experiment
I also looked at data from:
- Gravity Predictor Service
- CSR Low-Degree Gravity Harmonics GRACE Satellite
- National Centers for Environmental Information (NCEI)
Please type in the specific location you want and it will show a 3d Histogram and 2d Histogram with your results.
The 2D visualization of all possible locations is here.
- Type in a latitude and longitude and it outputs automatically (if available) without searching for the link. In lieu of this, you may type the link by modifying the code. All possible links are here.
- The ability to input a square and it will concatenate the multiple location data files together and output the concatenated data
- Create Interactive Globe Model of this to try to imitate the gravity potato Google Earth style
I want to thank (in no particular order):
- Cornelia Freund, Technical University Munich
- Dr. Christian Hirt, Technical University Munich
- Dr. Michael Kuhn, Curtin University
- Dr. John Ries, UT Austin
- Brian Meyer, NOAA
Without you, this project would have gone far more frustratingly


