
![]()
![]()


We are thrilled to announce the launch of the Explore Profiles UI, a brand-new way to explore and analyze your profiling data—now available as part of the Grafana Explore Apps suite! This new app brings you a queryless, intuitive experience for visualizing your profiling data, simplifying the entire process without the need to write complex queries.
explore_profiles_intro.mp4
Grafana Pyroscope is a continuous profiling platform designed to surface performance insights from your applications, helping you optimize resource usage such as CPU, memory, and I/O operations. With Pyroscope, you can both proactively and reactively address performance bottlenecks across your system.
The typical use cases are:
- Proactive: Reducing resource consumption, improving application performance, or preventing latency issues.
- Reactive: Quickly resolving incidents with line-level detail and debugging active CPU, memory, or I/O bottlenecks.
Pyroscope provides powerful tools to give you a comprehensive view of your application's behavior while allowing you to drill down into specific services for more targeted root cause analysis.
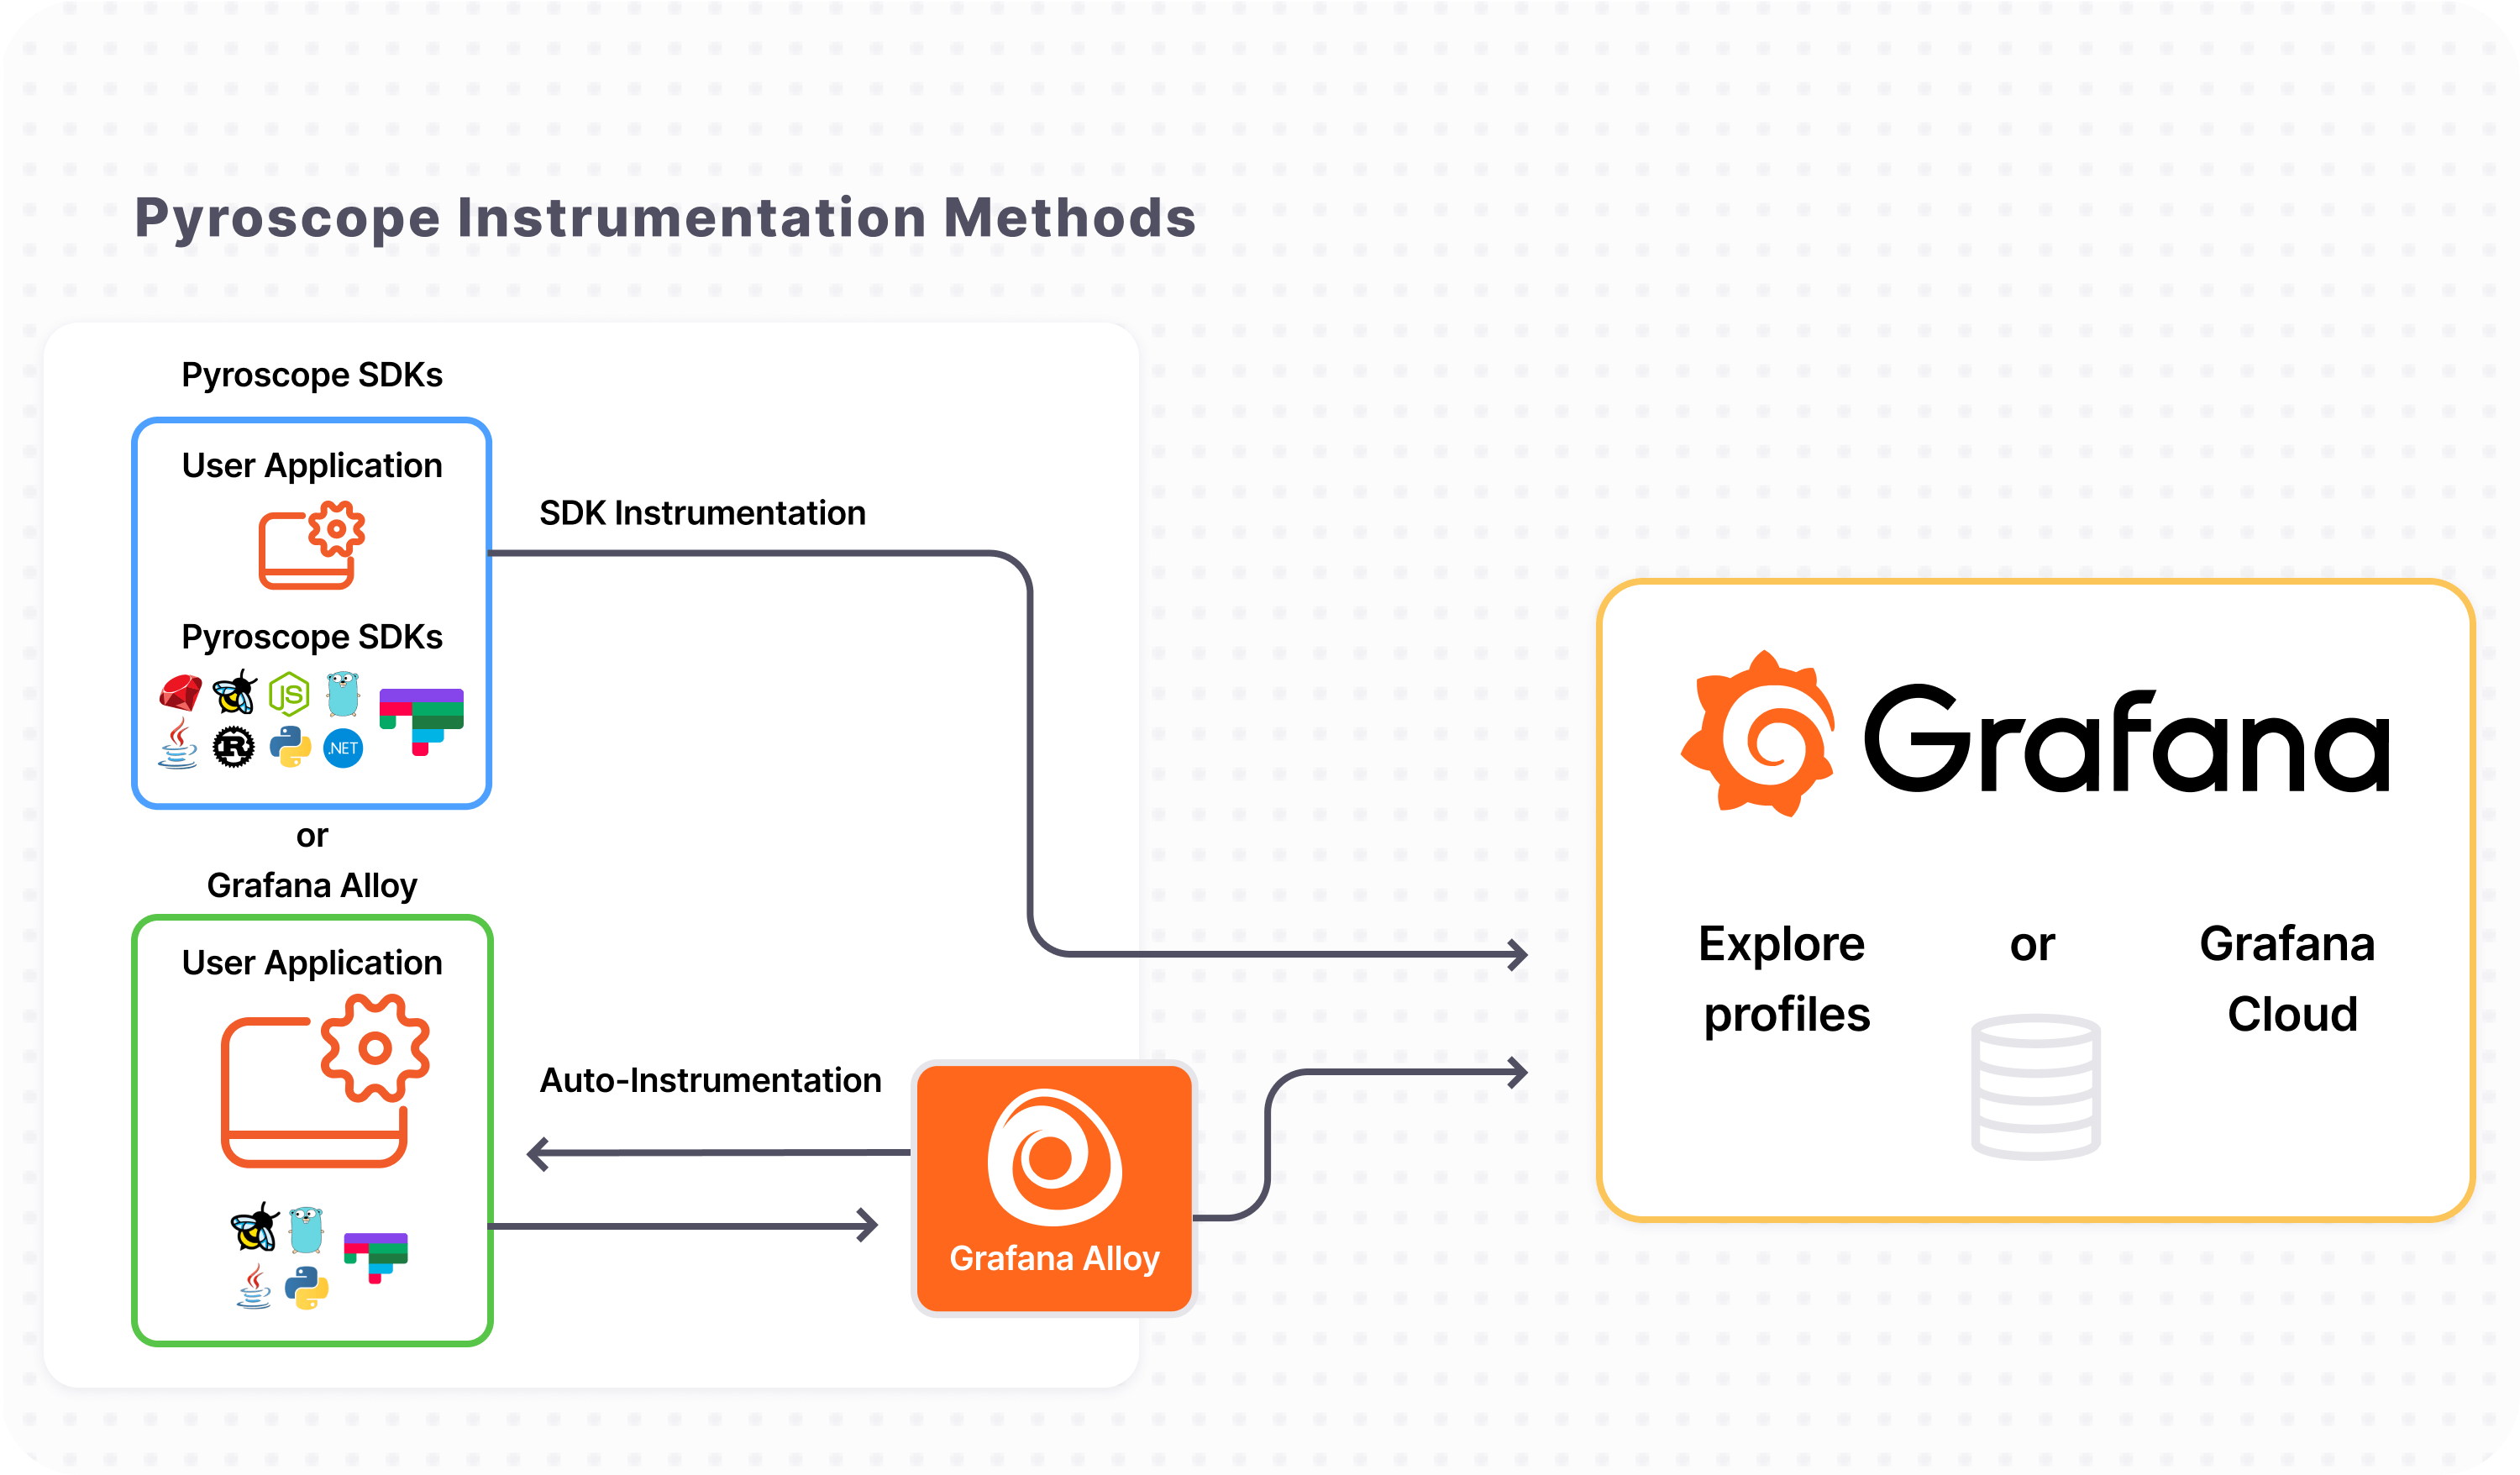
Pyroscope consists of three main components:
- Pyroscope Server: The server component that stores and processes profiling data.
- Pyroscope SDKs(push) or Grafana alloy(pull) : The client-side part of Pyroscope that collects profiling data from your applications and sends it to the server.
- Explore Profiles UI: A queryless, intuitive UI for visualizing and analyzing profiling data.

brew install pyroscope-io/brew/pyroscope
brew services start pyroscopedocker run -it -p 4040:4040 grafana/pyroscopeFor more documentation on how to configure Pyroscope server, see our server documentation.

The app UI and server are both installed and running automatically -- just start sending data!
You can run the Explore profiles UI in Grafana by installing the plugin from the Grafana Plugin Directory
For more information, check out the Explore Profiles README
For more information on how to use Pyroscope with other programming languages, install it on Linux, or use it in production environment, check out our documentation:
For more documentation on how to add the Pyroscope agent to your code, see the agent documentation on our website or find language specific examples and documentation below:


Our documentation contains the most recent list of supported languages and also an overview over what profiling types are supported per language.
Let us know what other integrations you want to see in our issues or in our slack.
Pyroscope is possible thanks to the excellent work of many people, including but not limited to:
- Brendan Gregg — inventor of Flame Graphs
- Julia Evans — creator of rbspy — sampling profiler for Ruby
- Vladimir Agafonkin — creator of flamebearer — fast flame graph renderer
- Ben Frederickson — creator of py-spy — sampling profiler for Python
- Adam Saponara — creator of phpspy — sampling profiler for PHP
- Alexei Starovoitov, Brendan Gregg, and many others who made BPF based profiling in Linux kernel possible
- Jamie Wong — creator of speedscope — interactive flame graph visualizer
To start contributing, check out our Contributing Guide


