0.6.1
Even better code completions
This is just an incremental bug-fix release. I focused on improving code completions. Also internal namespace caches should properly reflect incremental live code reloading of individual files (for Figwheel). I spent quite some time implementing more advanced beautification of function names. I have also fixed the welcome message which might not display under some circumstances. Also Dirac DevTools newly reports internal errors in a better way.
Code completions
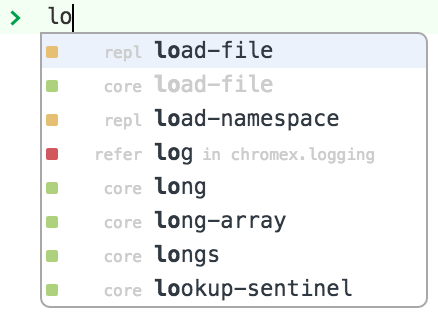
I have added support Google Closure modules, combined namespaces and new colors.
Color boxes should hint additional info about given suggestion. Let's look at some examples:
 |
 |
 |
Currently Dirac can display following colors:
- green - cljs namespaces and their content
- red - cljs macro namespaces and their content
- blue - Google Closure modules and their content
- orange - special REPL commands
Sometimes you can spot combined boxes. For example, red + green means a "combined namespace".
It tells you that this name represents both a cljs namespace and a macro namespace.
Gray names are shadowed, meaning that something else with the same name took precedence.
Better function names beautification
With enabled function name beautification you get the view on the left instead the raw right side.
 |
 |
Turned out demunging Javascript function names back to something resembling CLJS names properly is a non-trivial task. It cannot be perfect because the transformation is lossy. At least I did my best to detect common patterns and translate them back.
As you can see from the screenshot, I'm using superscripts to communicate specific arity calls. Also protocol names are displayed when calling protocol methods and I also throw in type names or anything else which happens to be encoded in given munged name.
Note that beautification is enabled by default and can be disabled in Dirac Extension options. The beautification is applied consistently across all DevTools UI anywhere where plain-text function names should be displayed. Most notably 'Call Stack' pane on Sources panel and stack traces printed in the console.
Welcome message
The welcome should always display on first open of Dirac DevTools window and switch to Console panel.
Dirac shows internal errors in your own console
Dirac is still a young project and sometimes bad things can happen. When Dirac code throws an unhandled exception, I intercept it and print it into your page's console as "Dirac Internal Error" with a stack trace.
This way you can easily spot when Dirac breaks and you can even copy&paste it for me to investigate it further (without me explaining how to open internal DevTools to investigate what exactly went wrong).
DevTools
Embedded DevTools merged f67efab...2211786 which should work best with Chrome ~53.0.2773.0.
Notable commits
f3b676e devtools: alias namespace mapping should say "is" not "as"
1e7f022 implant: fix "try reconnect" link
b072260 nrepl: make sure user gets java stack traces when dirac! command fails
54ce8f3 devtools: combine aliased macro namespaces in suggest boxes
3cbfb2e devtools: update namespaces cache incrementally on workspace changes
4f8a160 devtools: properly refresh macro namespaces cache on workspace changes
829d5c7 devtools: make closure libraries participate in code completions
efa02d1 implant: use present-function-name from cljs-devtools 0.7.1
c931771 devtools: warm up namespace cache when switching panels
a0ed326 implant: install reporter for unhandled DevTools exceptions
b14ebf3 devtools: fix welcome message display
All new work: v0.6.0...v0.6.1

