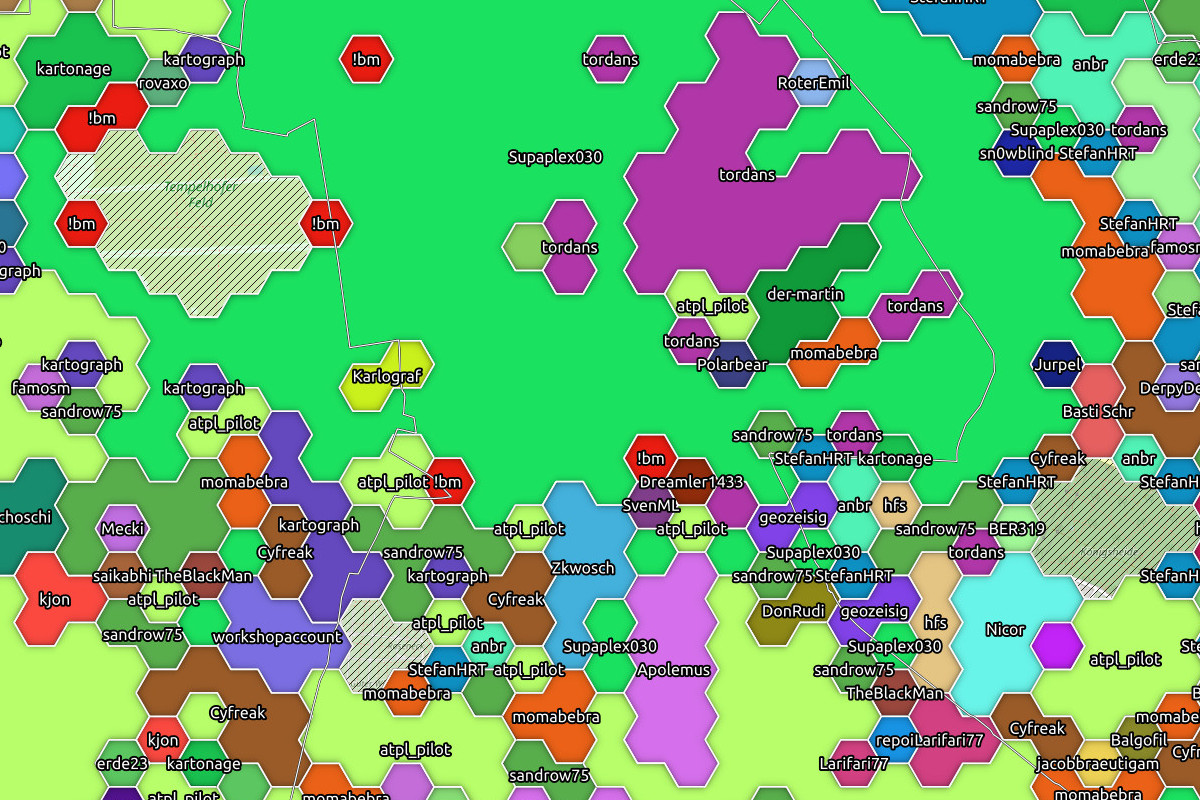
EN: Analysis and visualisation of active OSM users in an area for QGIS.
DE: Script zur Analyse und Visualisierung von aktiven OSM-Usern in einem bestimmten Gebiet in QGIS.
- Run this Overpass Query for the area of interest: https://overpass-turbo.eu/s/15gz (replace "name" and "admin_level" according to your administrative boundary of interest)
- Save output as csv file. If the area of interest is too large for a single query, several queries can be combined: a) Save the csv files for the different areas first, b) Remove the column headers except in the first file (Linux console: "sed 1d area_with_headers.csv > area.csv"), c) Merge the individual files into one file (Linux console: "cat part1.csv part2.csv part3.csv > total_area.csv").
- Start QGIS, add layer (DE: "Layer hinzufügen") as separated text file (DE: "Getrennte Textdatei als Layer hinzufügen").
- Save and add this point layer as a GeoPackage (gpgk) - DE: "Exportieren > Objekte speichern als"
- Use the "Delete duplicate geometries" (DE: "Doppelte Geometrien löschen") tool on points and save them again.
- Add or generate a grid over the area (e.g. 500 metre hexagons) or other desired grid shapes (e.g. city districts) for which processing is to be evaluated.
- Adjust the layer names for points (GeoPackage) and grid and the output file path at the top of the script. Specify which data you want to receive in which form, e.g. whether you also need the output as csv file for further evaluation.
- Run the script.
This script is still in its development stage. The final goal is to weight the data in such a way that mappers who are mainly active in an area are clearly visible on a map and it becomes recognisable who is mainly mapping in a place. This can also be a playful incentive to compete with others for dominance in an area ;)
