-
Notifications
You must be signed in to change notification settings - Fork 1
Home
Welcome to the ucvm_plotting wiki!

The UCVM plotting utilities have been separated from the UCVM core code. This will help simplify the UCVM core software distribution. Also, the UCVM core software has been migrated to Python3. The UCVM plotting utilities have not been migrated to Python2, and they require a Python2 installation.
UCVM Plotting scripts are Python2 based scripts, that use matplotlib, and basemap datasets. These scripts provides fairly simple command line interfaces, that query the user for basic information about desired plots, then call 1) the ucvm_query or other UCVM-based executable to retrieve the information needed for the plot, then 2) call Python plotting routines to create PNG files to display the results retrieved from UCVM.
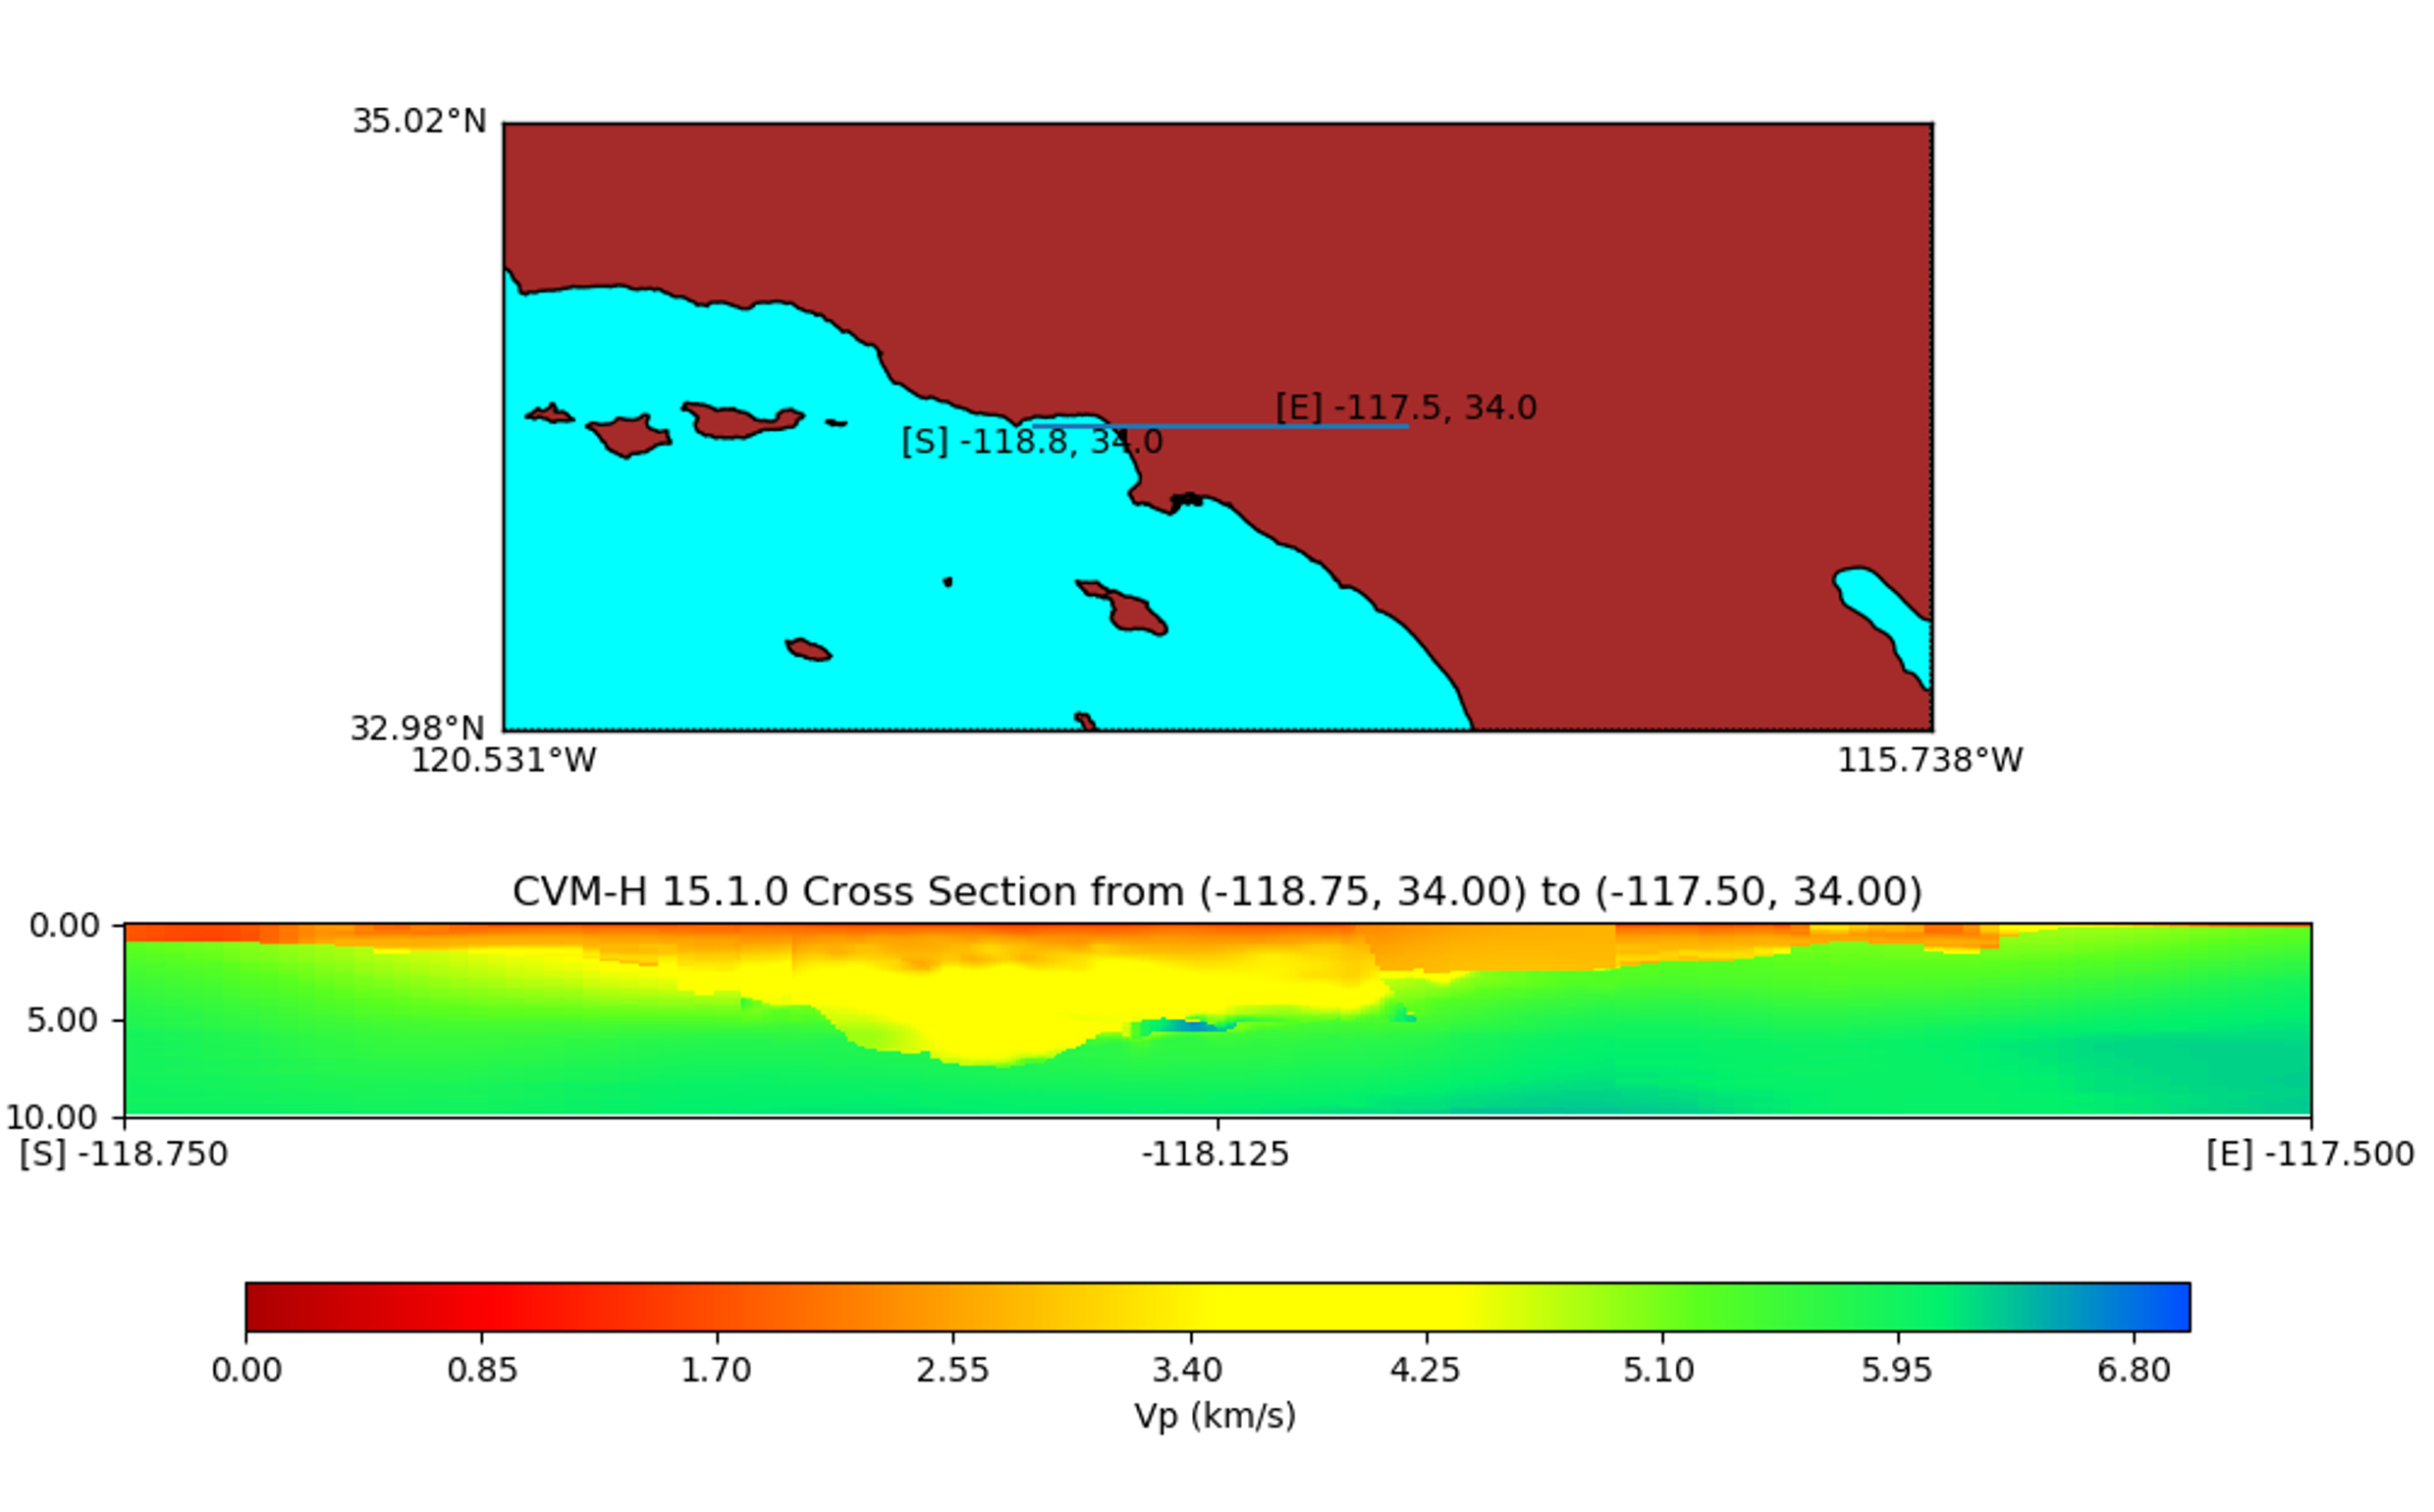
A variety of plots are available includind 1) 1D vertical profiles, 2) 2D horizontal and vertical slices, and 3) map-based plots showing properties imposed on maps of southern California. The command line users interface typically allows the user to select the type of plot, the geographincal resolution of the plot, the model to be queried, the specific material properties to be displayed, and a plot caption.

