-
Notifications
You must be signed in to change notification settings - Fork 1
App
Simply opening overview.html or trait.html in the web browser does not work:
browsers will not allow access to files on the local file system for security reasons.
There are multiple ways of using the app:
a) local http server
python -m http.server --cgi 8080This will start a web server to host your entire directory listing at http://localhost:8080/.
b) disable browser security features (not recommended)
-
Firefox: Set
security.fileuri.strict_origin_policytofalseinabout:config -
Chrome (or Edge, etc.): Start the browser like this:
chrome --allow-file-access-from-files
Navigate to overview.html in your browser or open our example output: small dataset or
large dataset.

Explanation:
-
A) Dendrogram of traits.
- blue rectangle: highlights a cluster of potentially related metabolites
-
B) Negative logarithms of the p-values calculated by Scoary2
- p-values range from high (left) to low (right)
- meaning of the symbols:
-
f: the p-value from Fisher’s test -
e: the p-value from the post-hoc test -
*: the product of the two values
-
- C) Trait names
- D) Pop-up that shows up when hovering over the traits in the dendrogram
See also: Understanding the p-values
Usage:
- Hovering over the traits opens a pop-up with more information, including information from
trait_info.tsv - Middle mouse clicks open
trait.htmlin a new tab - Clicks on the trait name at the very top of the pop-up opens
trait.html
Navigate to trait.html?trait=<name-of-some-trait> in your browser or open
our example output.

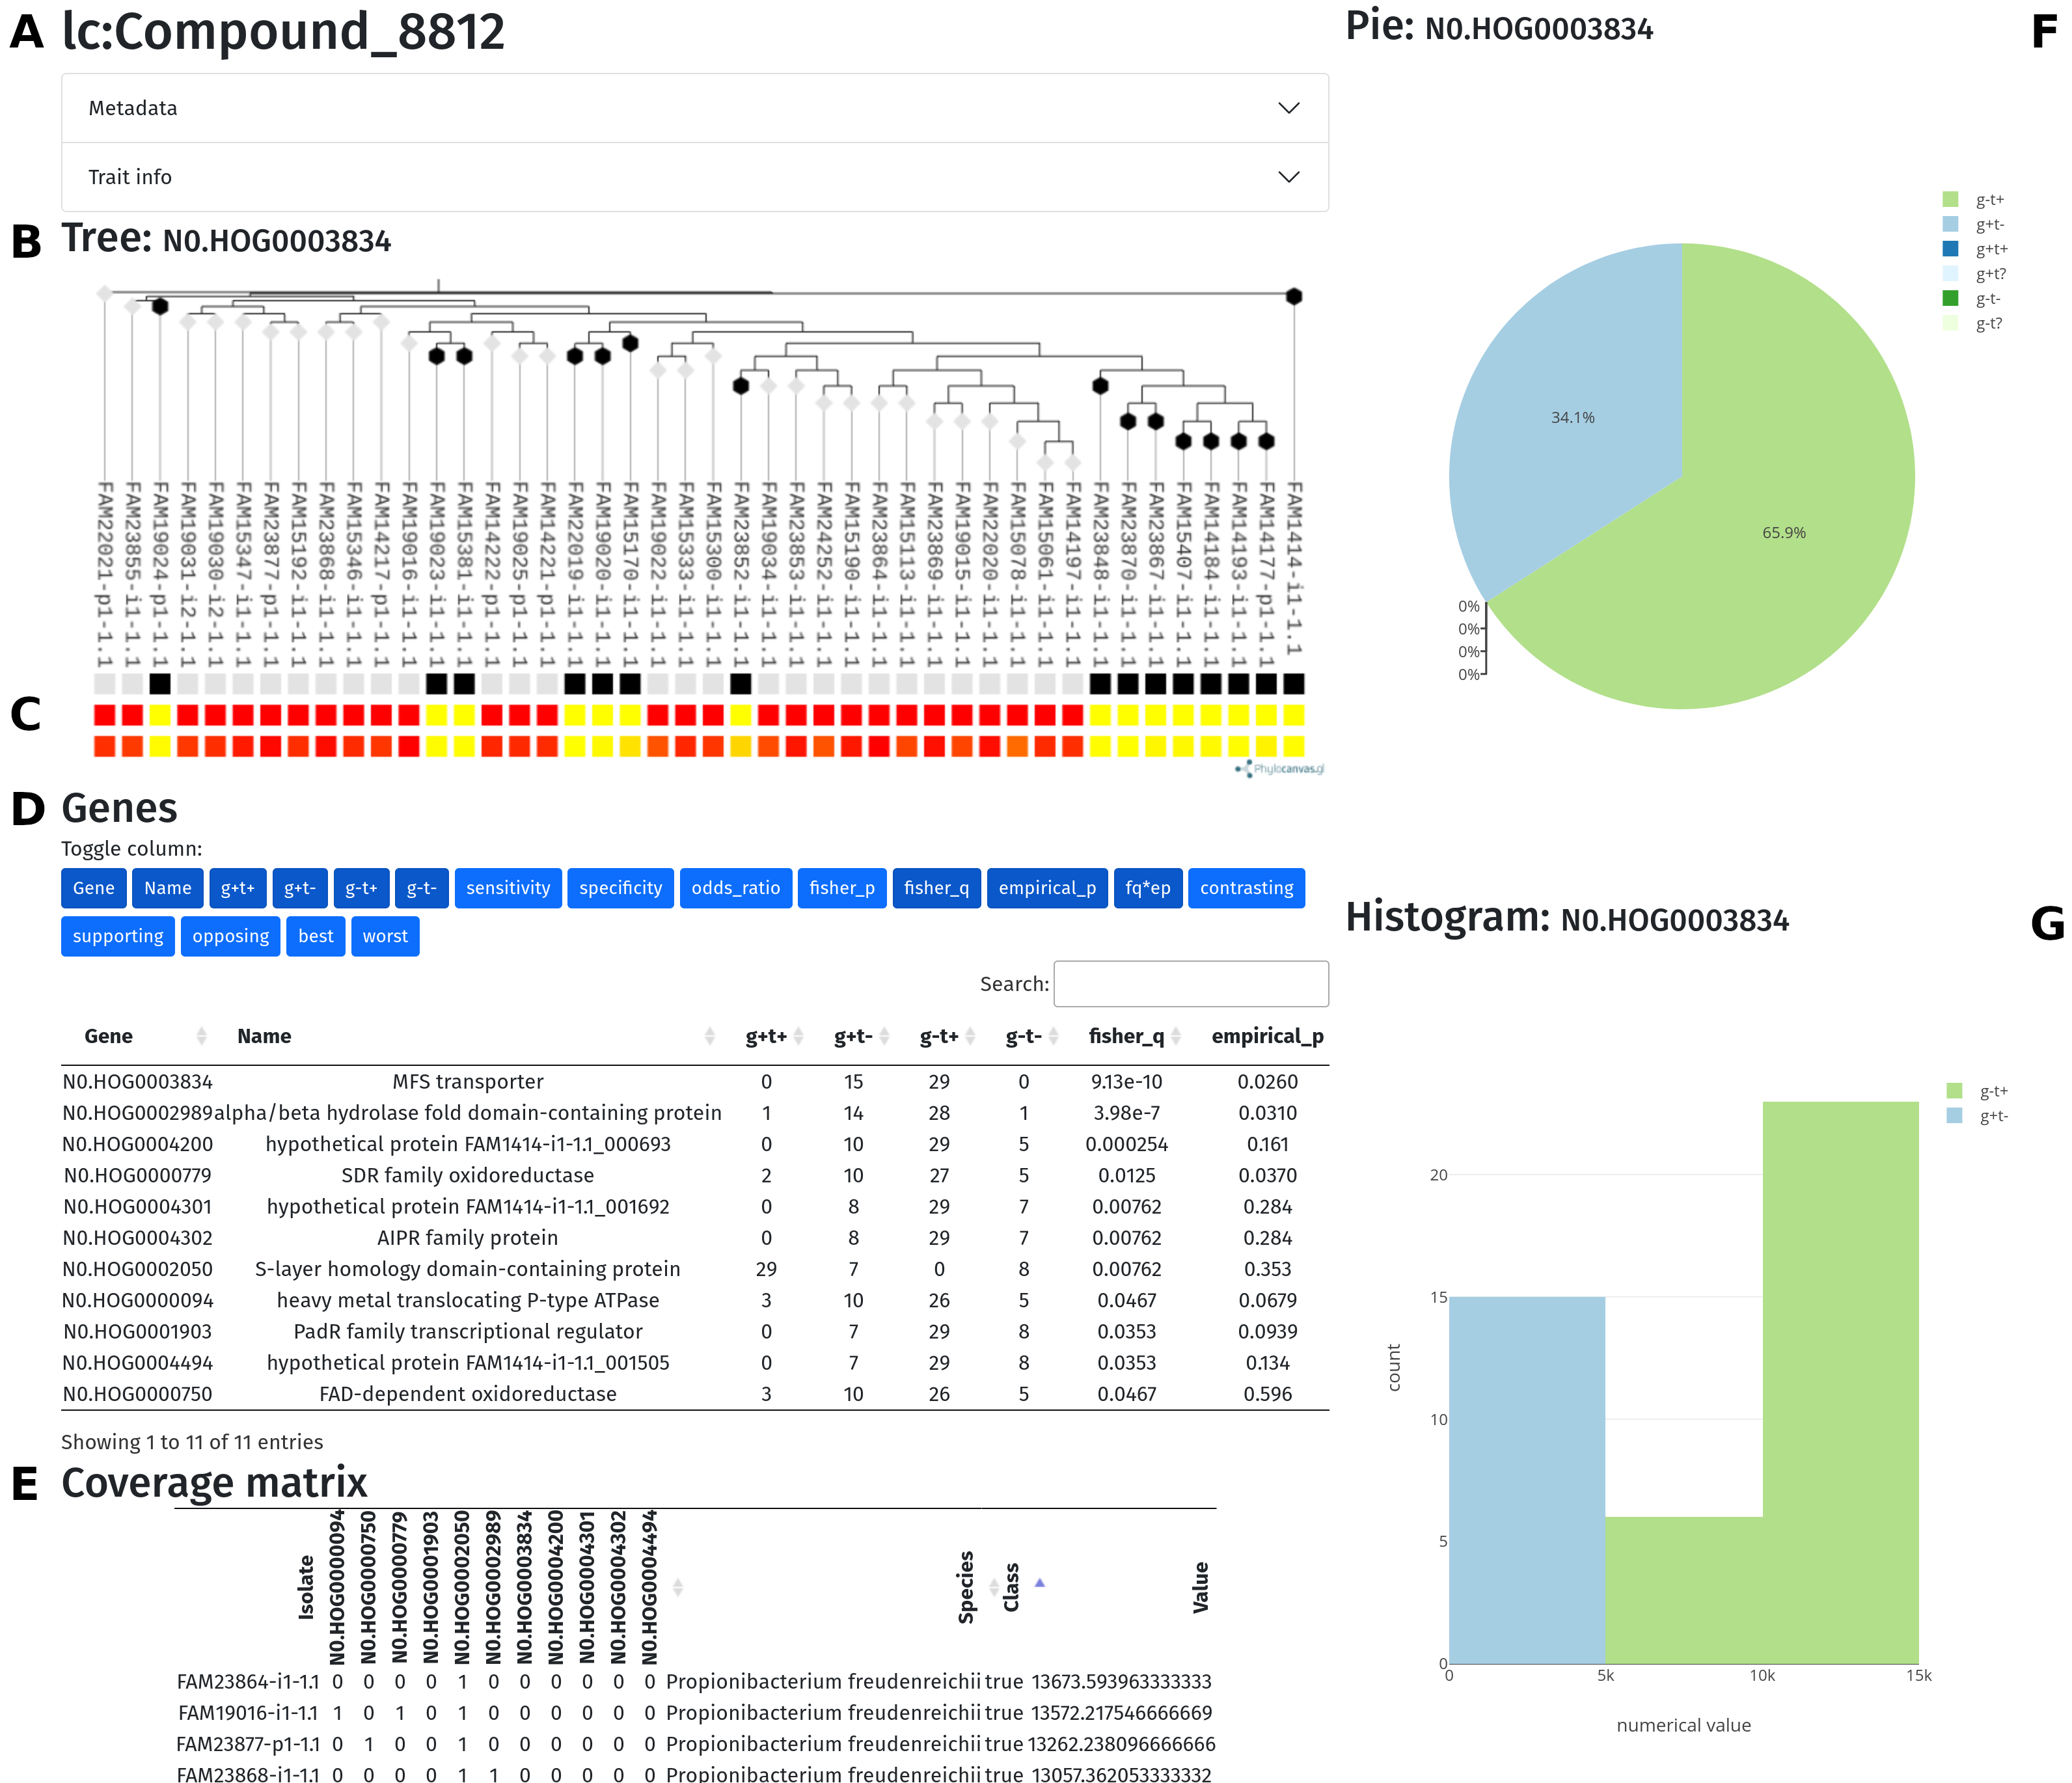
The second page (trait.html) of the Scoary2 data exploration tool.
Explanation:
- A) Trait name: Click on Metadata or Trait info to see more information.
- B) Phylogenetic tree of the isolates, name of the currently selected gene
-
C) Color bar
- top row: presence (white) / absence (black) of orthogene
- middle row: binarized trait
- bottom row: continuous trait.
-
D) Interactive version of the
results.tsvtable, see above- it is possible to show / hide columns by clicking of the corresponding buttons
- the list can be sorted by clicking on column titles
-
E) Interactive version of the
coverage_matrix.tsvtable, see above- the numbers in the cells tell the number of genes in the genome that have the annotation.
- includes information from
isolate_info.tsv - includes binary class and continuous values (if available) from
values.tsv
- F) Pie chart that shows how the orthogene and the trait intersect in the dataset.
-
G) Histogram of the continuous values, colored by whether each isolates
has the orthogene (
g+/g-) and the trait (t+/t-)
Usage:
- Clicks on a gene (in D and E)
- updates the plots
- depending on link-config, opens a pop-up with further options
- Clicks on a cell in the coverage matrix (E)
- depending on link-config, opens a pop-up with a list of genes (if the input was
gene-list)
- depending on link-config, opens a pop-up with a list of genes (if the input was
The file app/config.json modifies the behavior of trait.html.
Parameters:
(Self-explanatory parameters were omitted.)
-
table-config: Configuration for the Genes table (D)-
sanitize-genes: PGAP formats some gene identifiers with stupid prefixes (e.g.gnl|extdb|GENE_000000); if set totrue, these are removed -
default-hidden-cols: column names fromresults.tsvwhich are hidden by default -
float-cols: column names fromresults.tsvwhich are floats, not strings
-
-
tree-config: Configuration for the phylogenetic tree (visualized using phylocanvas.gl)-
type: options:Diagonal,Hierarchical,Radial,Rectangular -
leaf-nodes: options forshapeproperty: click here
-
-
link-config: Configure the app to link with external pages (custom URLs)-
single-gene: template string- used in coverage matrix (E)
- placeholder:
{gene}
-
many-genes:- dictionary with potentially multiple entries
- key is a description
- value is a template string
- placeholders:
{orthogene},{have-isolates},{lack-isolates},{all-genes},{positive-genes},{negative-genes},{unclear-genes}
-
concat-string: character(s) to combine arrays
-
Example used on demo site
{
  "colors": {
    "g+t+": "#1f78b4", "g+t-": "#a6cee3", "g+t?": "#e0f4ff", "g-t+": "#b2df8a", "g-t-": "#33a02c", "g-t?": "#edffdf"
  },
  "table-config": {
    "sanitize-genes": true,
    "default-hidden-cols": ["sensitivity", "specificity", "odds_ratio", "contrasting", "supporting", "opposing", "best", "worst", "fisher_p"],
    "float-cols": ["fisher_p", "fisher_q", "empirical_p", "fq*ep", "best", "worst", "sensitivity", "specificity"]
  },
  "tree-config": {
    "type": "Hierarchical",
    "height": 400,
    "leaf-nodes": {
      "g+": {"shape": "hexagon", "fillColour": "#000000"},
      "g-": {"shape": "diamond", "fillColour": "#e3e3e3"}
    },
      "color-scale": ["yellow", "red"],
      "metadata-bars": {
        "g+": {"colour": "#000000", "label": "present"},
        "g-": {"colour": "#e3e3e3", "label": "absent"},
        "t+": {"colour": "red", "label": "present"},
        "t-": {"colour": "yellow", "label": "absent"},
        "t?": {"colour": "#ffffff", "label": "unclear"}
    }
  },
  "link-config": {
    "single-gene": "https://opengenomebrowser.bioinformatics.unibe.ch/gene/{gene}",
    "many-genes": {
      "gene trait matching": "https://opengenomebrowser.bioinformatics.unibe.ch/gene-trait-matching/?g1={have-isolates}&g2={lack-isolates}",
      "compare genes": "https://opengenomebrowser.bioinformatics.unibe.ch/compare-genes/?genes={all-genes}"
    },
    "concat-string": "+"
  }
}