Cross interaction based outlier score (XBOS) is a cluster-based algorithm for unsupervised anomaly detection. It uses k-means clustering for the first stage, and then calculate cross interaction between clusters as the second stage. Because of this second stage, A small cluster near another large cluster is treated as if that is a middle cluster, so that the data points belong to the cluster is scored 'not so anomalous' as a result.
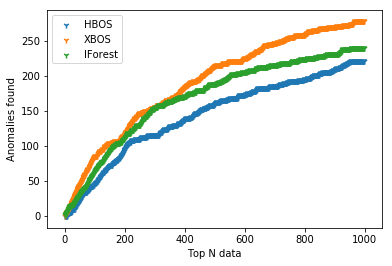
XBOS assumes independence of the features as same as HBOS. XBOS shows very good performance on Kaggle credit card dataset compared to Isolation Forest and HBOS.
XBOS is a really simple algorithm and implemented in just 55 lines of Python code.
from pandas import DataFrame
from xbos import XBOS

data = DataFrame(data={'attr1':[1,1,1,1,2,2,2,2,2,2,2,2,3,5,5,6,6,7,7,7,7,7,7,7,15],'attr2':[1,1,1,1,2,2,2,2,2,2,2,2,3,5,5,6,6,7,7,7,13,13,13,14,15]})
xbos = XBOS(n_clusters=3)
result = xbos.fit_predict(data)
for i in result:
    print(round(i,2))
Create XBOS object and call 'fit_predict()'. Returning value is an array of anomaly score. The lower, the more abnormal.
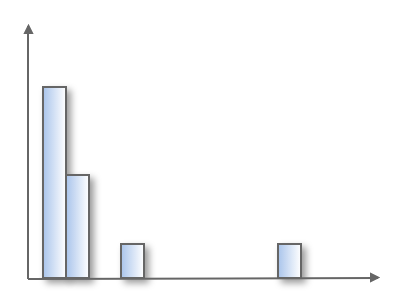
Consider one-dimensional data. The histogram looks like this.

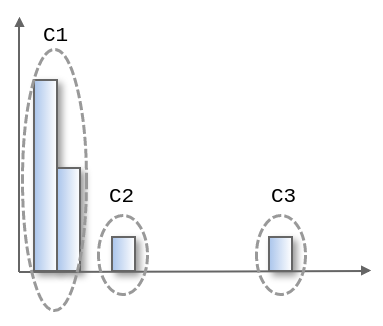
We apply k-means clustering to the data(k=3), and get 3 clusters, C1/C2/C3.

C1 is large, C2 and c3 are small. So at this point, anomaly score of each clusters are considered as below.
C1: normal
C2: abnormal
C3: abnormal
Since C2 is close to C1, we want to think it is not as abnormal as C3.
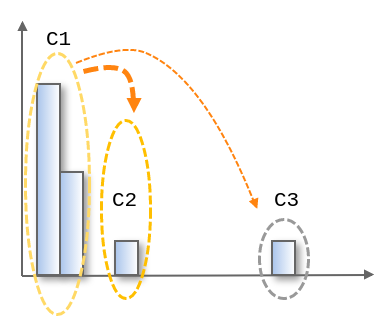
So we calculate the interaction between clusters as red arrows as below.
The closer the clusters are to each other, and the larger the cluster, the stronger the interaction is.
C2 is strongly affected by C1 and the anomaly score of it has been changed to 'not so abnormal'. On the other hand, C3 is slightly affected by C1 and it still remains as 'abnormal'.
C1: normal
C2: not so abnormal
C3: abnormal
BSD 3 Clause

