-
-
Notifications
You must be signed in to change notification settings - Fork 75
Perl Debugger
Starting version 1.6, plugin contains perl debugger. Debugger utilizes it's own debugging module working via socket, so you may debug scripts locally or remotely.
To be able to debug perl scripts, you should install perl side of the debugger - Devel::Camelcadedb. Module should be installed on machine you are running perl script.
For remote debugging you need to configure environment variables on the perl side. Thre are three environment variables:
-
PERL5_DEBUG_ROLE- should be set to 'server' if you want to make IDE connect to perl process and to 'client' if you want to make perl process connect to the IDE. This may be depend on your network configuration. -
PERL5_DEBUG_HOST- host to bind or connect, depending onPERL5_DEBUG_ROLE -
PERL5_DEBUG_PORT- port to listen or connect, depending onPERL5_DEBUG_ROLE
After that, you just need to start perl with -d switch: perl -d:Camelcadedb yourscript.pl
In case of local debugging, you don't need to configure environment, just start debugging from IDE interface and it will configure it for you.
There are two available Run/Debug configurations for perl scripts.

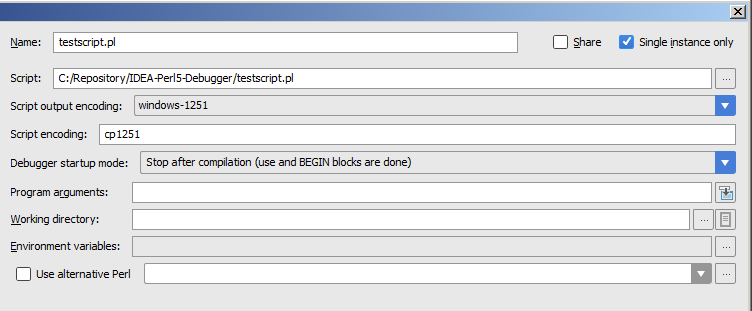
This configuration is for local scripts running and debugging. Following settings available:
- Name - configuration name
- Share - check this box if you want to create xml file with this configuration to keep in in VCS, for example.
- Single instance only - allows to has only one active debugging session with this configuration. Strongly recommended to avoid unclear problems with connections and scripts output.
- Script - path to script you want to run or debug
- Script output encoding - scripts output will be redirected to the IDE's console and you should specify encoding for it.
- Script encoding - this encoding being used only for debugging: converting scalars and file sources (See
How Debugger Handles Encodingssection below). - Debugger startup mode - has three options: stop ASAP, stop after compilation and run to the first breakpoint.
- Script arguments, working directory and environment variables are pretty much self-explanatory.
After creating run configuraion you may "Start debug" and see what happens.

This configruration may be used for debugging a website running on another machine. It would be really nice if you have a local copy of running project, but it's not necessary.
Configuration options looks pretty much the same as in Perl configuration with few differences:
- Remote project root - being used by debugger to map remote file paths to the local ones. If path is wrong - breakpoints wont work.
- Connection mode - defines what is going to connnect to what. Relates to
PERL5_DEBUG_ROLEenvironment variable. - Server host and port - relates to
PERL5_DEBUG_HOSTandPERL5_DEBUG_PORTrespectively.
Configuration editor provides a template command line for starting your script according to selected settings.
IDE attempts to connect to process immediately (if perl acts as host) and stops trying if it fails. Perl process tries to connect to IDE 10 times with 1 second pause, and stops if there is no success.
Normal scenario is to start server part (perl process or IDE debugging session) and than start the client part.
Related discussions: here and here
- Local and remote debugging
- Step in, step over, step out, run to cursor, pause actions with possible forcing to skip breakpoints on the way (NB: pause may triggers on next sub invocation.)
- Breakpoints with possible condition and eval expressions. Dependent breakpoints provided by IDE.
- Stacktrace view with sub invocation arguments and local variables (scalars with utf8 flag on will have a blue icon border)
- Layers information for handles
- Tie information for variables
-
filenoinformation for handles - Namespaces browser
- Loaded sources browser
- Compiled evals browser
- Watches
- Breakpoints support for eval-based templating engines. Requires support from engine side.
- Atm there is no threading support, it hasn't been tested in threaded environment
- forked processes has not been tested
- Watch evals are being done in scalar context, so if you'll try to watch
@somearray, you'll probably get just number of elements. To make this work, you should add a reference to watch:\@somearray - If you want to make an anon hash in the watch expression, prefix it with a plus sign, so perl could understand that this is not a code block:
+{map {$_->{key} => 1} @list} - Avoid mutating watches or conditions. e.g. watch like
$somevar++or$sth->fetchrow_hashrefwill break your code flow. - If you are familiar with perl native debugger and actions from there, in IDEA they are part of breakpoints, see 'Log evaluated expression'. Note, that your expression should not print anything, it should return a value which should be printed in console of IDE. Breakpoint condition affects these too. So they will be printed only if condition is met.
- Incorrectly set
Script encodingmay cause performance issues on IDE side - Loading non-utf files with set breakpoints on project opening forces using IDE default encoding for them (IDE bug). Will be fixed in next IDEA version.
As soon as perl knows only utf8 and bytes, it was not a trivial question how to handle non-utf encodings. For now it works this way:
- IDE always waiting utf8 from debug socket.
- If the debugger detects that utf8 flag is on, it sends data (variables values, files sources) as is.
- If the debugger detects that content has no utf8 flag set and contains bytes with code > 0x80, it encodes the data from the configured 'Script encoding' to utf8 using Encode::from_to
- All watches and breakpoint conditions will be converted to configured script encoding
- Home
- Getting started
- Features
- Languages & Frameworks
- Integration
- Version Managers
- Misc