Best Python Data Viz Libraries
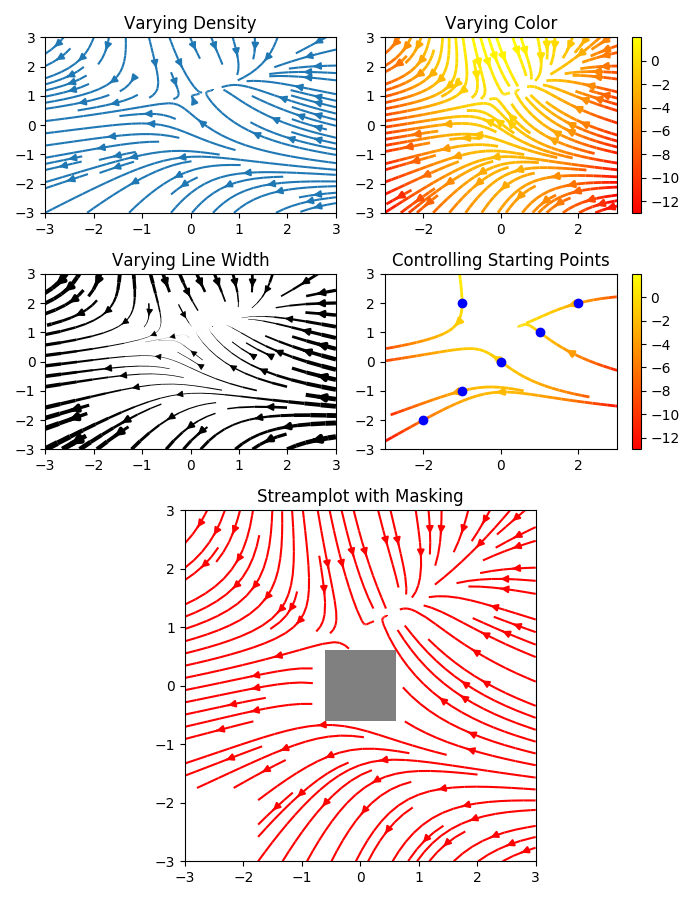
The versatility of Matplotlib can be used to make many visualization types:
- Scatter plots
- Bar charts and Histograms
- Line plots
- Pie charts
- Stem plots
- Contour plots
- Quiver plots
- Spectrograms
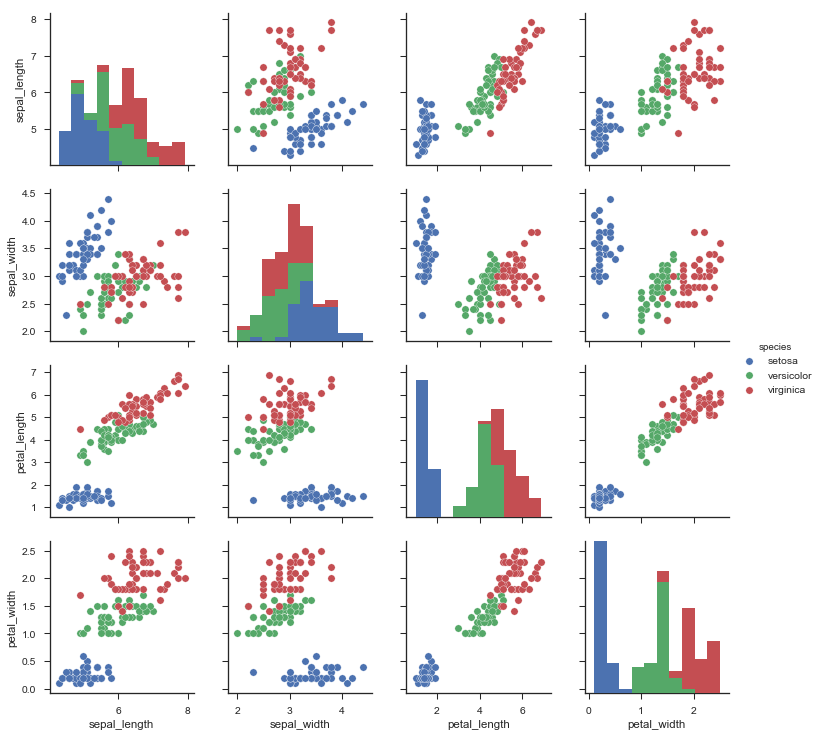
Seaborn is a popular data visualization library that is built on top of Matplotlib. Seaborn’s default styles and color palettes are much more sophisticated than Matplotlib. Beyond that, Seaborn is a higher-level library, meaning it’s easier to generate certain kinds of plots, including heat maps, time series, and violin plots.
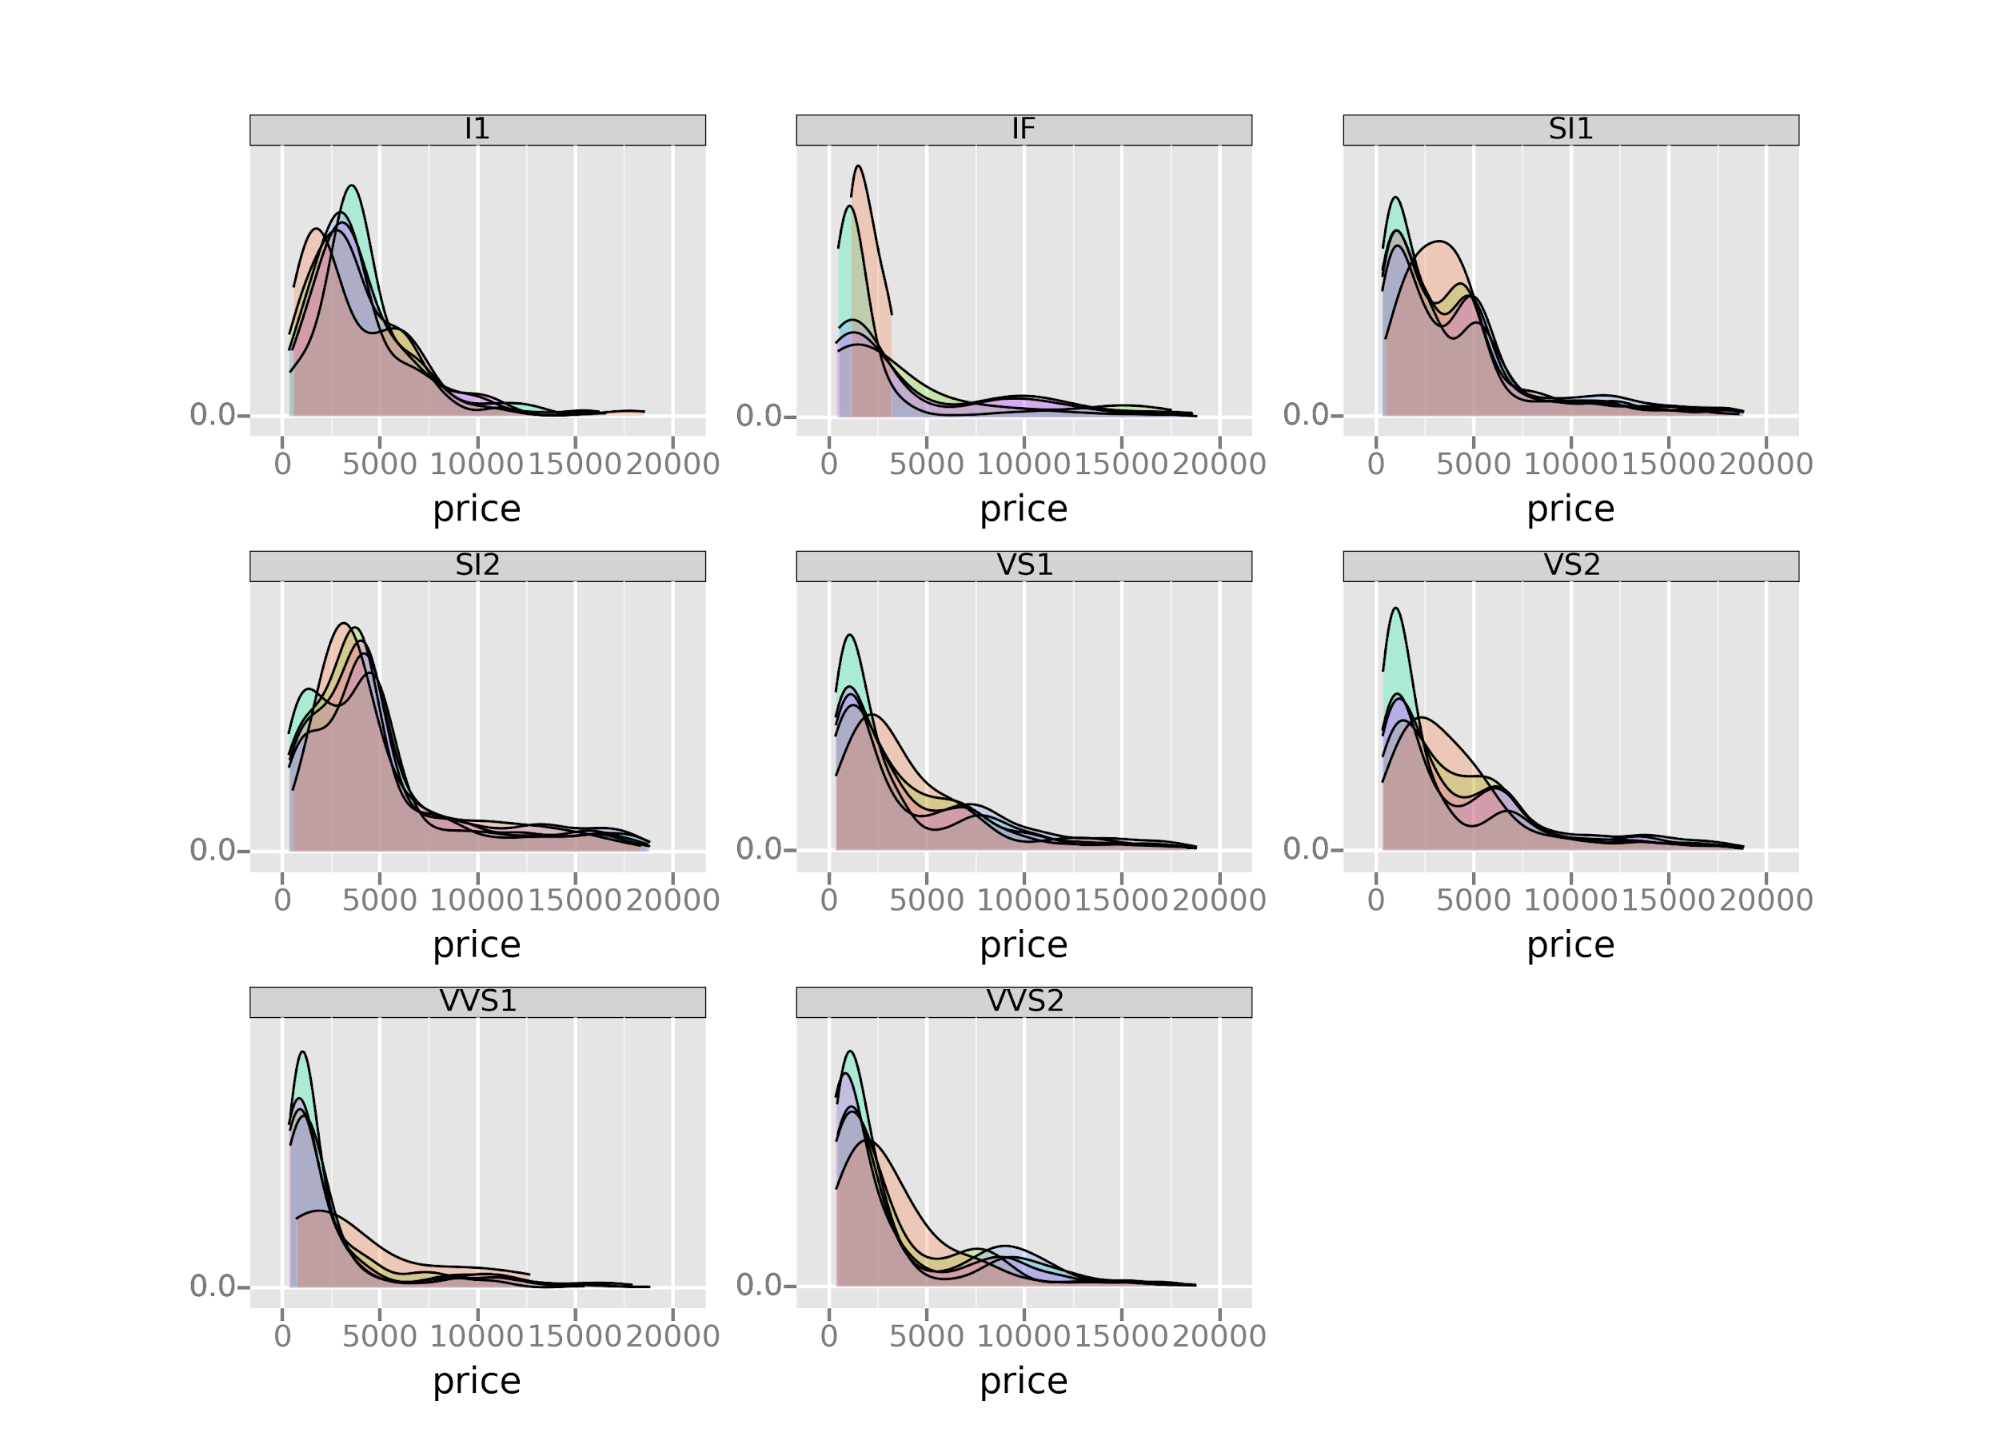
Altair is a declarative statistical visualization python library based on Vega-lite. Declarative means you only need to mention the links between data columns to the encoding channels, such as x-axis, y-axis, color, etc. and the rest of the plotting details are handled automatically. Being declarative makes Altair simple, friendly and consistent. It is easy to design effective and beautiful visualizations with a minimal amount of code using Altair.
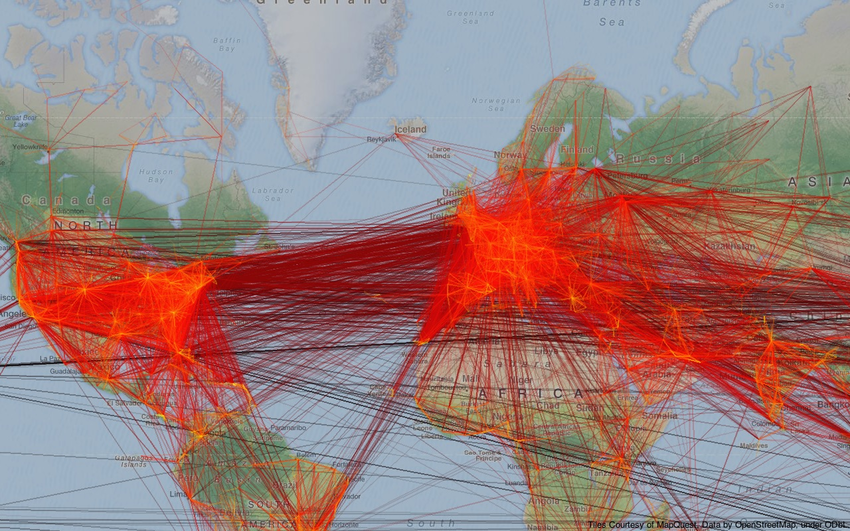
Geoplotlib is a toolbox used for plotting geographical data and map creation. It can be used to create a variety of map-types, like choropleths, heatmaps, and dot density maps. Pyglet (an object-oriented programming interface) is required to be installed to use Geoplotlib.
Geoplotlib reduces the complexity of designing visualizations by providing a set of in-built tools for the most common tasks such as density visualization, spatial graphs, and shape files.
Since most Python data visualization libraries don’t offer maps, it’s good to have a library dedicated to them.


