-
Notifications
You must be signed in to change notification settings - Fork 18
Rainfall manager
The rainfall manager is where the user can store rainfall data (gauged rainfall, IDF curves) and create synthetic rainfall.
All the rainfall manager data are saved on the disk under a specific file that is still the same with any projects. This allows keeping rainfall from one project to others. When opening Lekan (new project or with an existing project), the rainfall manager load always the same file and this file is the last saved one. It is also possible to open another file, and then this one will be loaded by default for the next start of Lekan. But it is recommended to work with the same file to avoid bad reference to a rainfall if the user changes the file during editing a project.
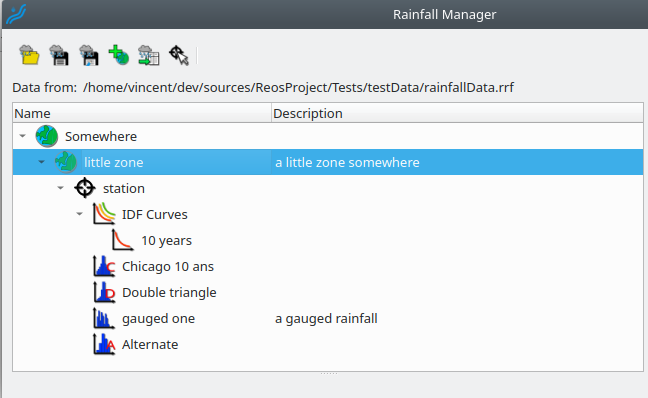
The rainfall manager is a tree of different types of element:
- Zone: this type represents a geographical zone (what the user wants: country, region...). A zone can contain other zones or stations.
- Station: this type, that can be locaized by a point in the map, contains the rainfall data: gauged rainfalls, IDF curves and/or synthetic rainfalls
- IDF curves: element that contains Intensity Duration curves
- Intensity Duration Curve: parametric equation used to obtain the intensity of rainfall depending on its duration
- Gauged rainfall: rainfall data with constant time step that can be filled manually by user or imported from files
- Synthetic rainfall: rainfall that is designed depending on Intensity Duration curve(s) and/or other parameters
Zones, stations and IDF curves elements are container of data. These elements are only defined by a name and a description (optional).
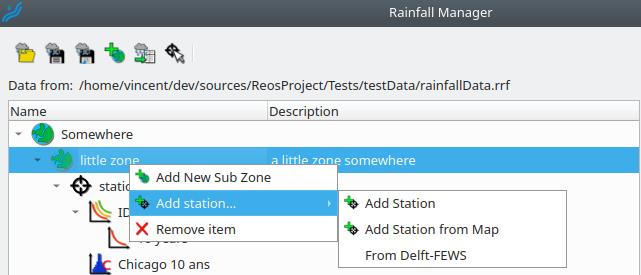
All the items can be added/removed through a the context menu after a right click on the tree.
Stations contain all the rainfall data: IDF curves, gauged rainfalls, or synthetic rainfalls. A station can be geolocalized with a point on the map canvas. Once the rainfall manager is opened, each geolocalized rainfall station is associated with a marker on the map canvas.
To add a station, the user has the following possibilities after a right-click on a zone item:
- Add Station: a non-geolocalized void station will be added.
- Add Station from: a geolocalized station will be added after the user picks a point on the map canvas.
- From Deflt-FEWS: after choosing a XML Delft-FEWS file, the user can load existing gauged data from the file in a new associated geolocalized station (see Delft-FEWS provider)
Intensity Duration curve doesn't have name but have a return period. This return period is used for displaying the curve in the rainfall tree.
To define the intensity of rainfall depending on the duration, Lekan support, for now, two parametric equations :
Montana :
Sherman :
For each of this formula, the variable 't' is the rainfall duration and the user can create several duration intervals for which the parameters (a, b, c, n ...) have to be entered. To add an interval, double-click on the green cross 
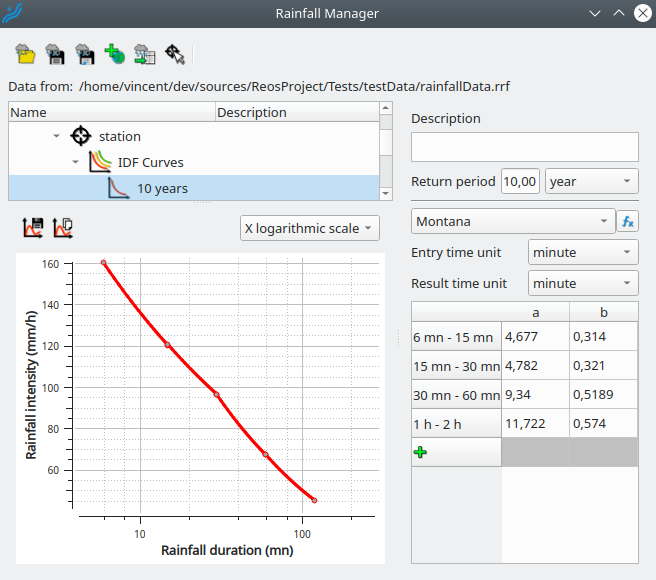
As for this formula, depending on who has evaluated the parameters, the unit time of the duration can be different from the intensity's unit time. The user can set the unit time for the entry and the unit time for the result corresponding to the parameters. Defaults are minute for entry duration and hour for intensity result (that is mm/hours).
Gauged rainfall is rainfall with a constant time step with values from a rain gauge station or defined by the user as wanted.
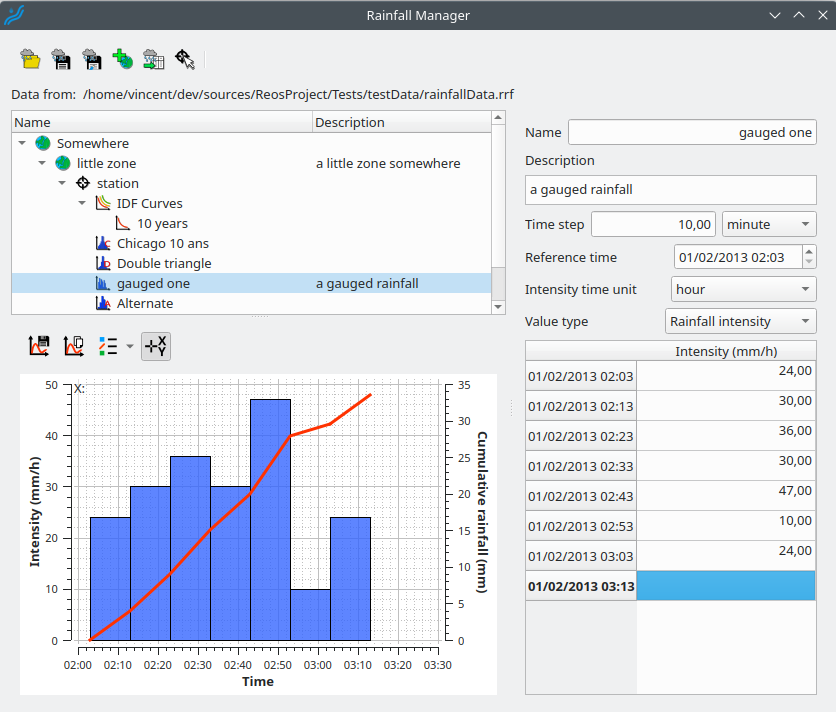
The reference time, that is date/time when the rainfall starts, has to be entered. The user must also define the time step.
Then the user can enter value one by one or copy/paste in the table.
The value can be the incremental height per time step or the intensity for each time step. If the intensity is chosen, the time unit has to be also set.
It is also possible to import rainfall from a text file by pushing the corresponding button 
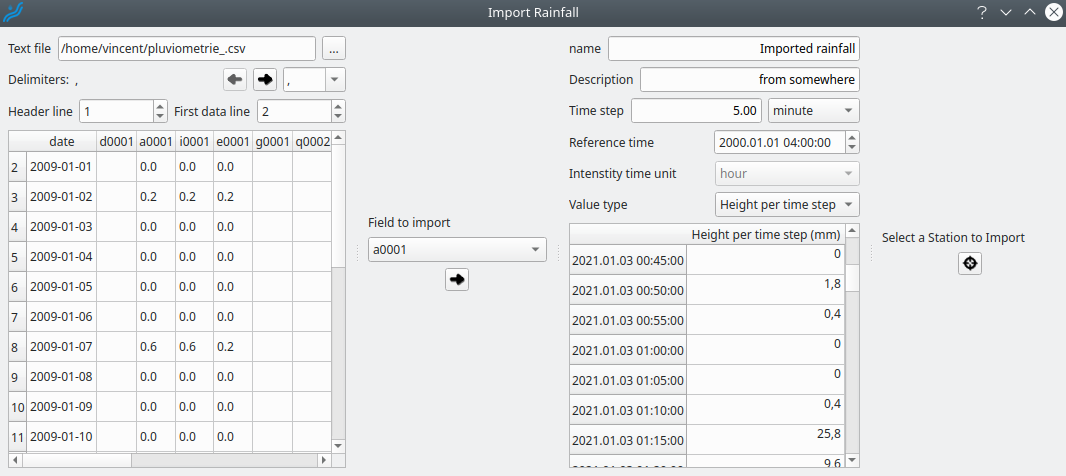
Once this window open, the first step is to choose a text file.
If there are several columns in the files, it is necessary to choose one or many delimiters: choose or fill a delimiter and press 

Then, set the line number of the header line (if none, set 0) and the line number corresponding to the data's beginning.
The preview table allows the user to control the settings and to choose the field. Once the field is selected, pressing 
- name and description of the rainfall (description is optional)
- the time step of the data
- the reference time of the data, that is the date/time when the gauged rainfall start
- the type value: height per time step (incremental) or the rainfall intensity, both have to be in millimeter
In the end, the user has to choose a station where to import the rainfall (it is necessary to create this station before opening the import window).
Lekan allows the possibility to designed specific rainfall with the following methods :
- Chicago method
- Alternating block method
- Double triangle method (Desbordes)
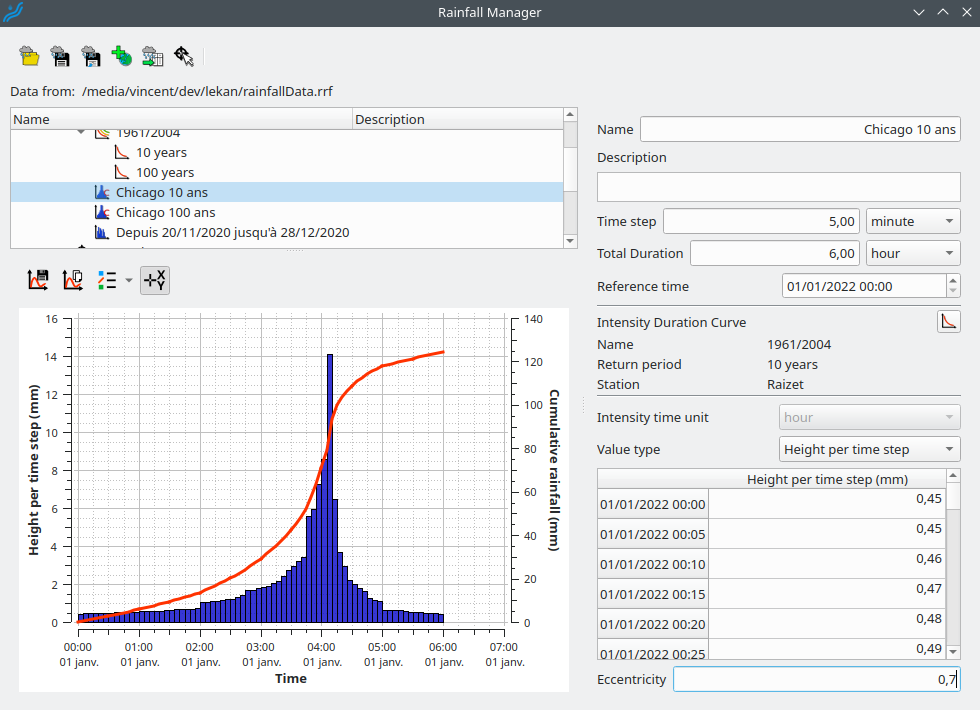
To designed these rainfalls, the user has to set:
- an Intensity Duration curve, the user can choose from the existing one by pushing the button
- a time step
- a total duration
- an eccentricity coefficient, between 0 and 1, 0.5 is for a central peak.
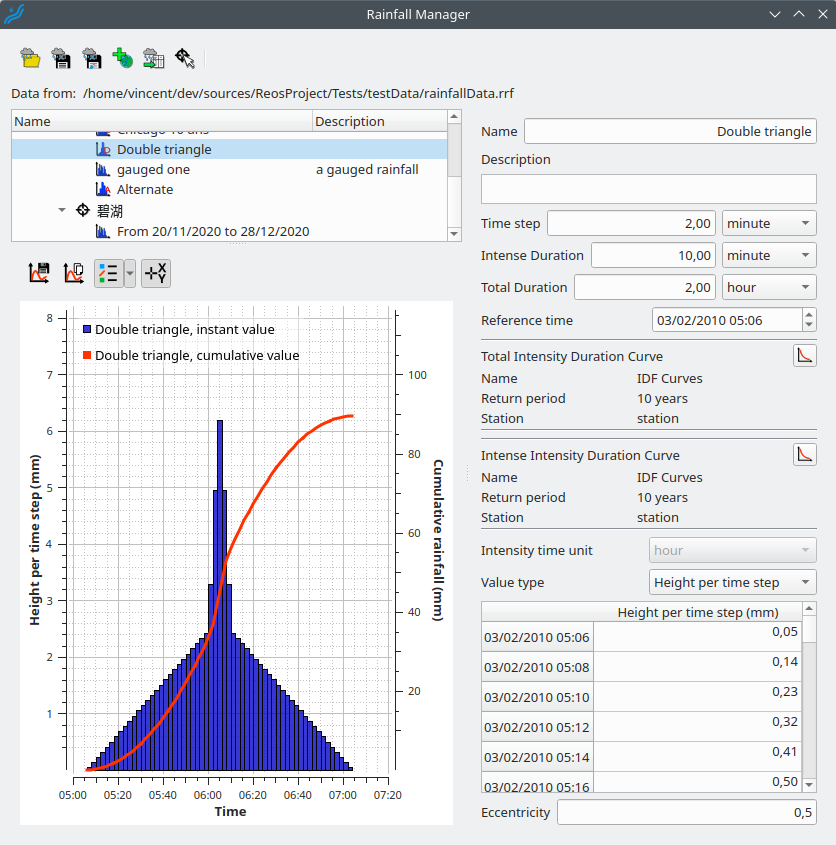
This rainfall is based on two duration: a total duration that is all the rain duration, and an intense duration that is a peak with a shorter duration. Those two duration are associated to a return periods that can be different, generally, the intense one is greater than the total one. The shape of this designed rainfall is a double triangle.
To designed this rainfall, the user has to set:
- a time step
- an intense duration
- a total duration
- an Intensity Duration curve for the intense duration and another for the total duration, the user can choose them from the existing one by pushing the buttons
- an eccentricity coefficient, between 0 and 1, 0.5 is for a central peak.
This is a side bar


