This program can be used as a QC step in the processing of high throughput sequence data to try to validate the source of the cells you have used in your experiment.
People generally know the cell line they are using, and with databases such as COSMIC cell lines and the Cancer Cell Line Encyclopedia we have lists of variants associated with different cell lines which we can use to confirm their identity.
Scientists are aware that contamination of cell lines is a problem which can affect a suprisingly high proportion of all published studies. This tool makes it easy for you to check your own data to spot any problems early in your data processing.
Before installing Cell Line Sleuth on your system there are a few dependencies you will need to install
-
A java runtime environment. Any recent version of java is fine. This will be available in your operating system pacakge repository.
-
An R installation. The graphing in Cell Line Sleuth uses ggplot so you will need to install R and you will need to have installed the tidyverse package (
install.packages("tidyverse")). If you want to generate graphs in SVG format (using the--svgoption) then you'll also need to install the R svglite package (install.packages("svglite")) -
Python3 - you need python3 (version 3.6 or above)
You can go to the releases page and grab the binary distribution of the latest release. This is the same binary for Linux, OSX or Windows. Simply uncompress this file someone on your machine to install the software.
The analysis in Cell Line Sleuth is based around the identification of SNPs which are unique to a particular cell line. Before you can run an analysis of your data you will need to prepare the list of SNPs to use.
The SNPs can be extracted from the COSMIC cell lines. This dataset is available only after registering with COSMIC so we can't distribute it. You will need to sign up for a COSMIC account and download the CosmicCLP_MutantExport.tsv data file. This data is freely accessible to academic researchers, but commerical users will need to obtain a licensing agreement from COSMIC.
Since there are so many cell lines in COSMIC you are unlikely to want to test them all. We would therefore advise selecting the lines which you know are used in your lab, plus some of the common contaminants (HeLa wins by a mile on this front). The default set of lines which we test are:
- MCF7
- HeLa
- COLO-205
- HCT-116
- H9
..but you can pick whichever ones you like. The list of cells you can choose can be seen here
You then need to run the cosmic_diagnostic_snps.py file, which is in the cosmic folder of the distribtion. This takes the COSMIC data file and a list of cell lines as input and generates a SNP file which you'll need for the analysis.
For example you might run:
cosmic_diagnostic_snps.py --cells MCF7,HeLa,COLO-205,HCT-116,H9 CosmicCLP_MutantExport.tsv snp_list.txt
..which will generate a file called snp_list.txt with your SNPs in it.
Once you have generated your SNPs you can analyse a BAM file, which must have been aligned against GRCh38 (hg19) and must have chromosome names as the sequence identifiers. This can be from data from many different library types. RNA-Seq will probably be most common, but genomic, ChIP, ATAC libraries should all work. About the only thing which won't (at the moment) are bisulphite transformed libraries. Since COSMIC focusses on SNPs in exomes then RNA-Seq will have the best coverage. Other techniques may give poorer results because of lower coverage of the targetted SNPs.
To run the analysis you use the sleuth.py script. This takes your SNP file from the first step, and an aligned BAM file as arguments.
sleuth.py snp_list.txt test.bam
The sleuth.py program will generate two output files. A text file which will list all of the observed SNPs along with a count of their occurrance in your file. An example of the output from this file would be:
LINE     ID           CHR POS       ZYG REF ALT REFCOUNT ALTCOUNT OTHERCOUNT
COLO-205 COSV55280872 4   8228284   het G   A   1        0        0
COLO-205 COSV55562985 15  57518396  het G   T   3        2        0
COLO-205 COSV61245067 1   146144707 het G   A   1        0        0
COLO-205 COSV55889265 14  96306725  het C   G   4        1        0
COLO-205 COSV54489884 19  7922070   het C   T   13       10       0
COLO-205 COSV56749283 2   43699867  het A   G   1        0        0
COLO-205 COSV54865500 20  50959766  het T   C   5        0        1
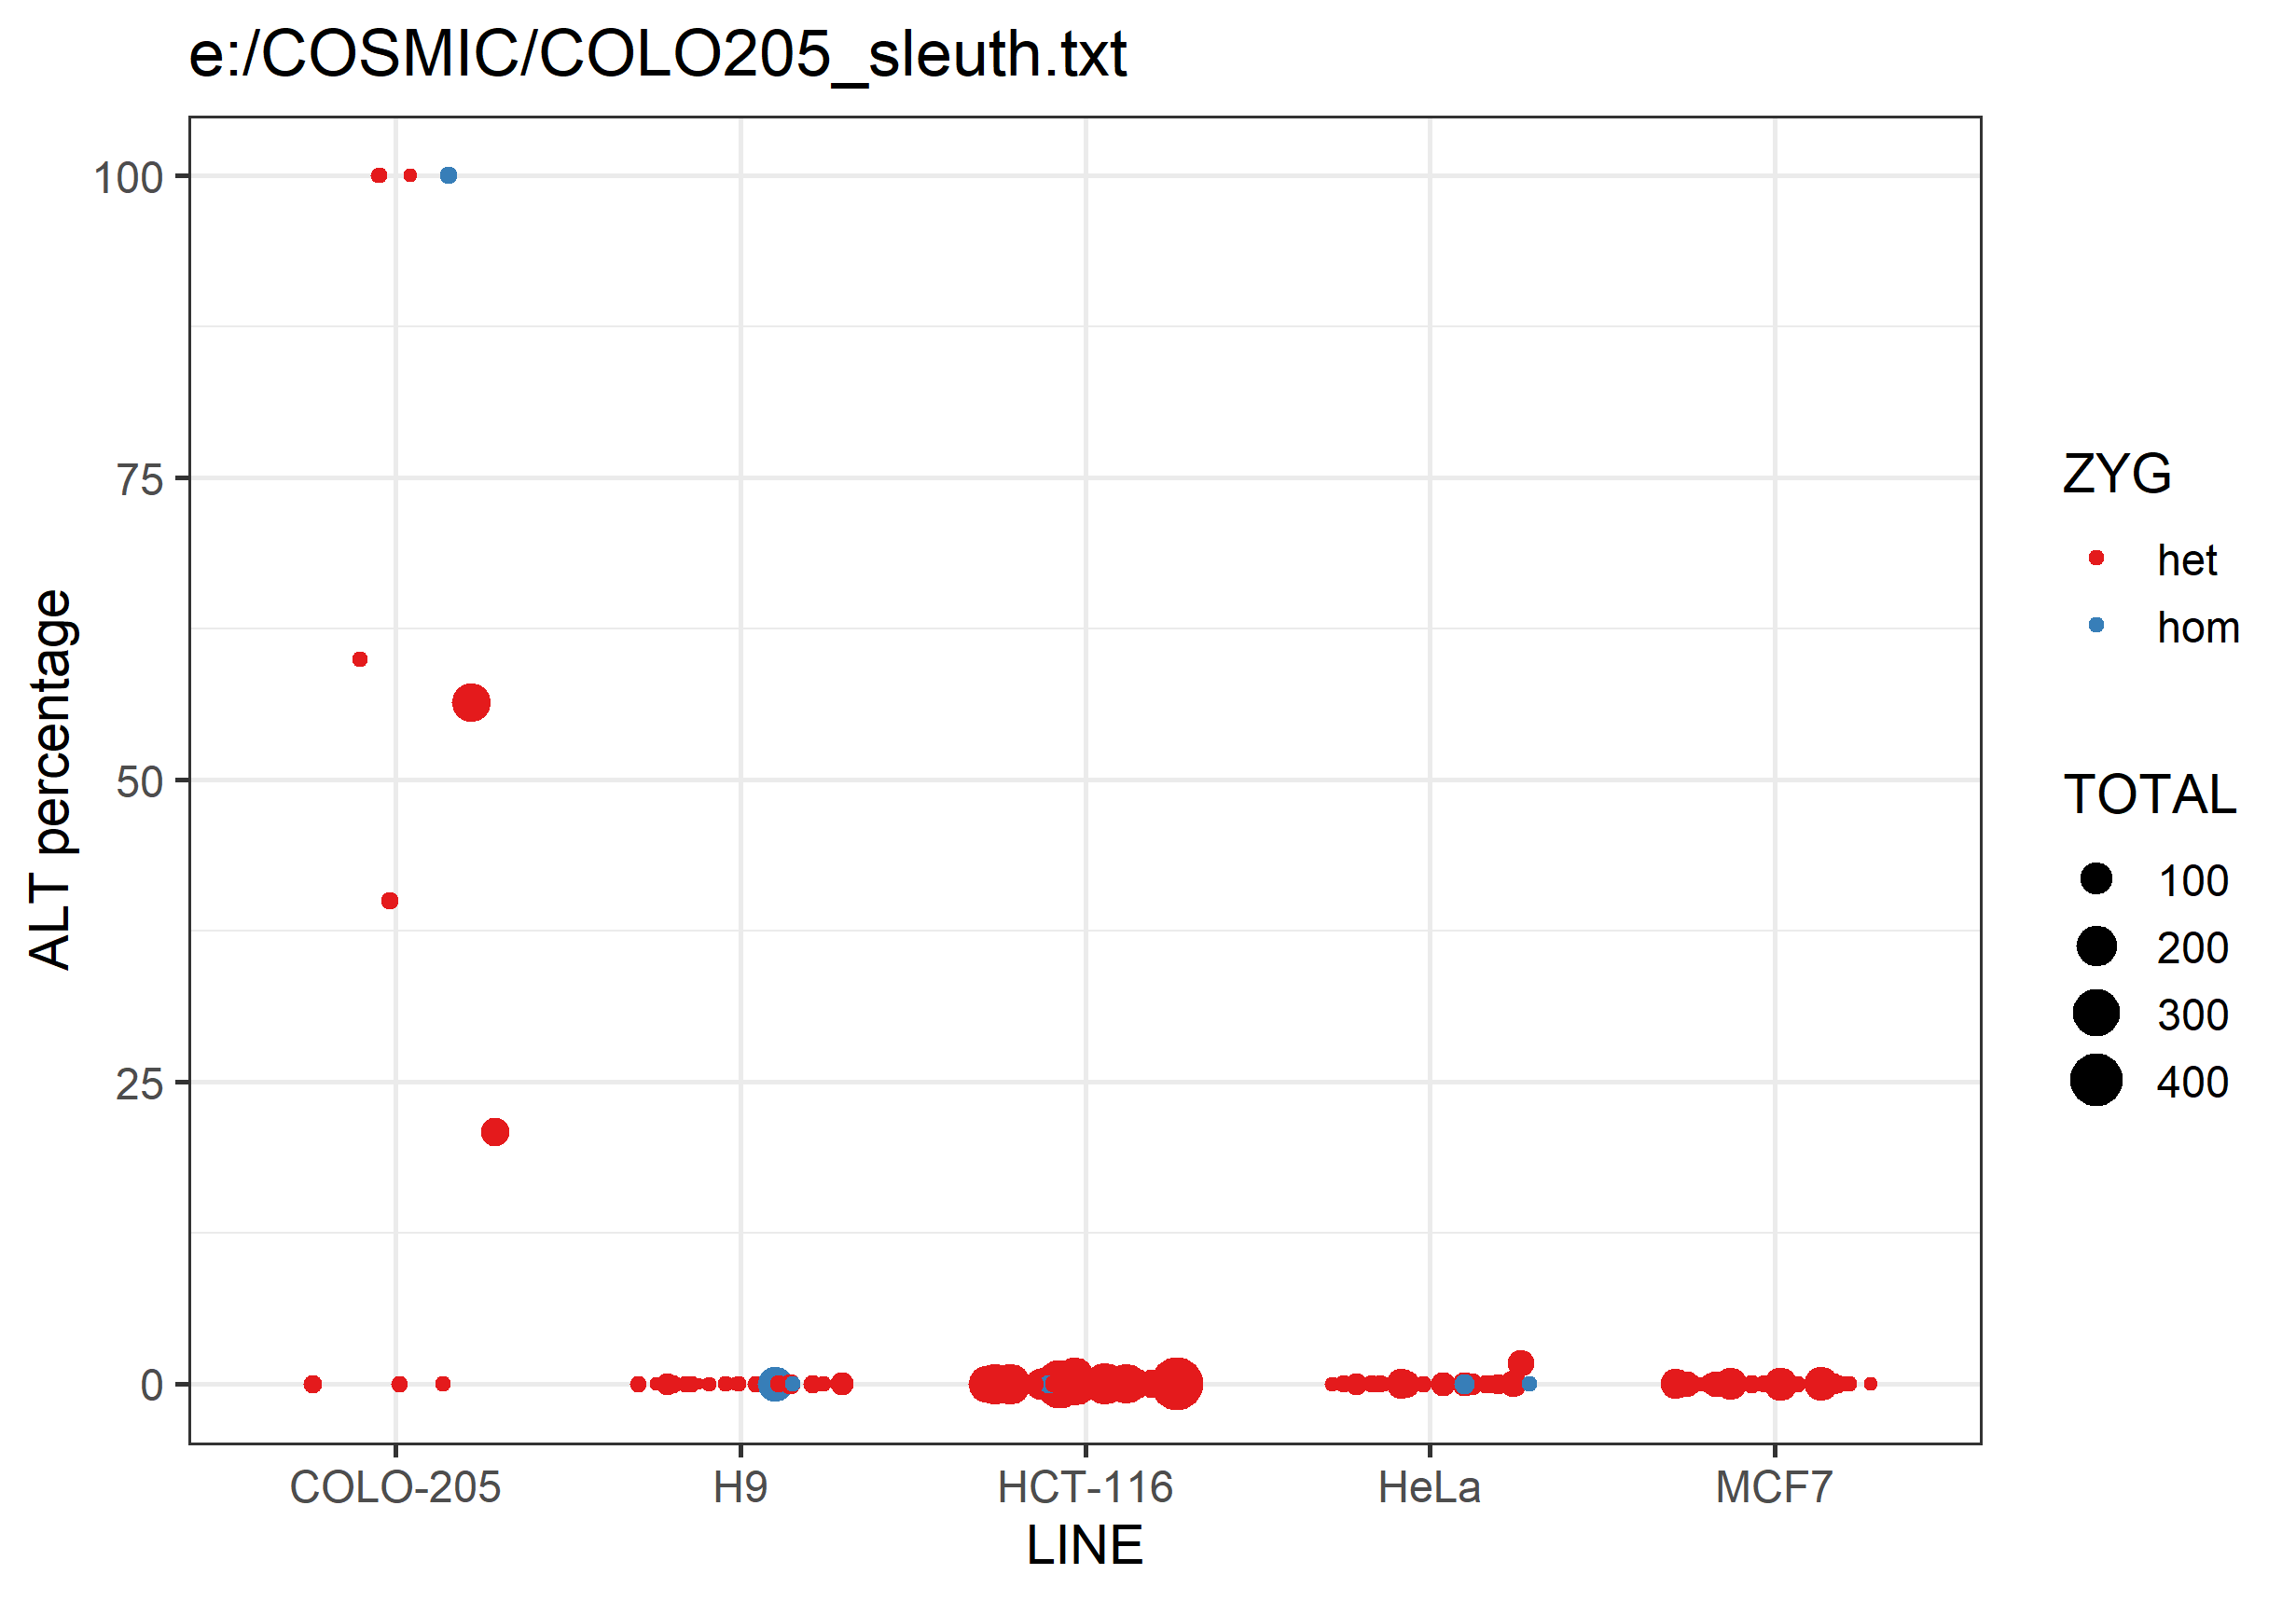
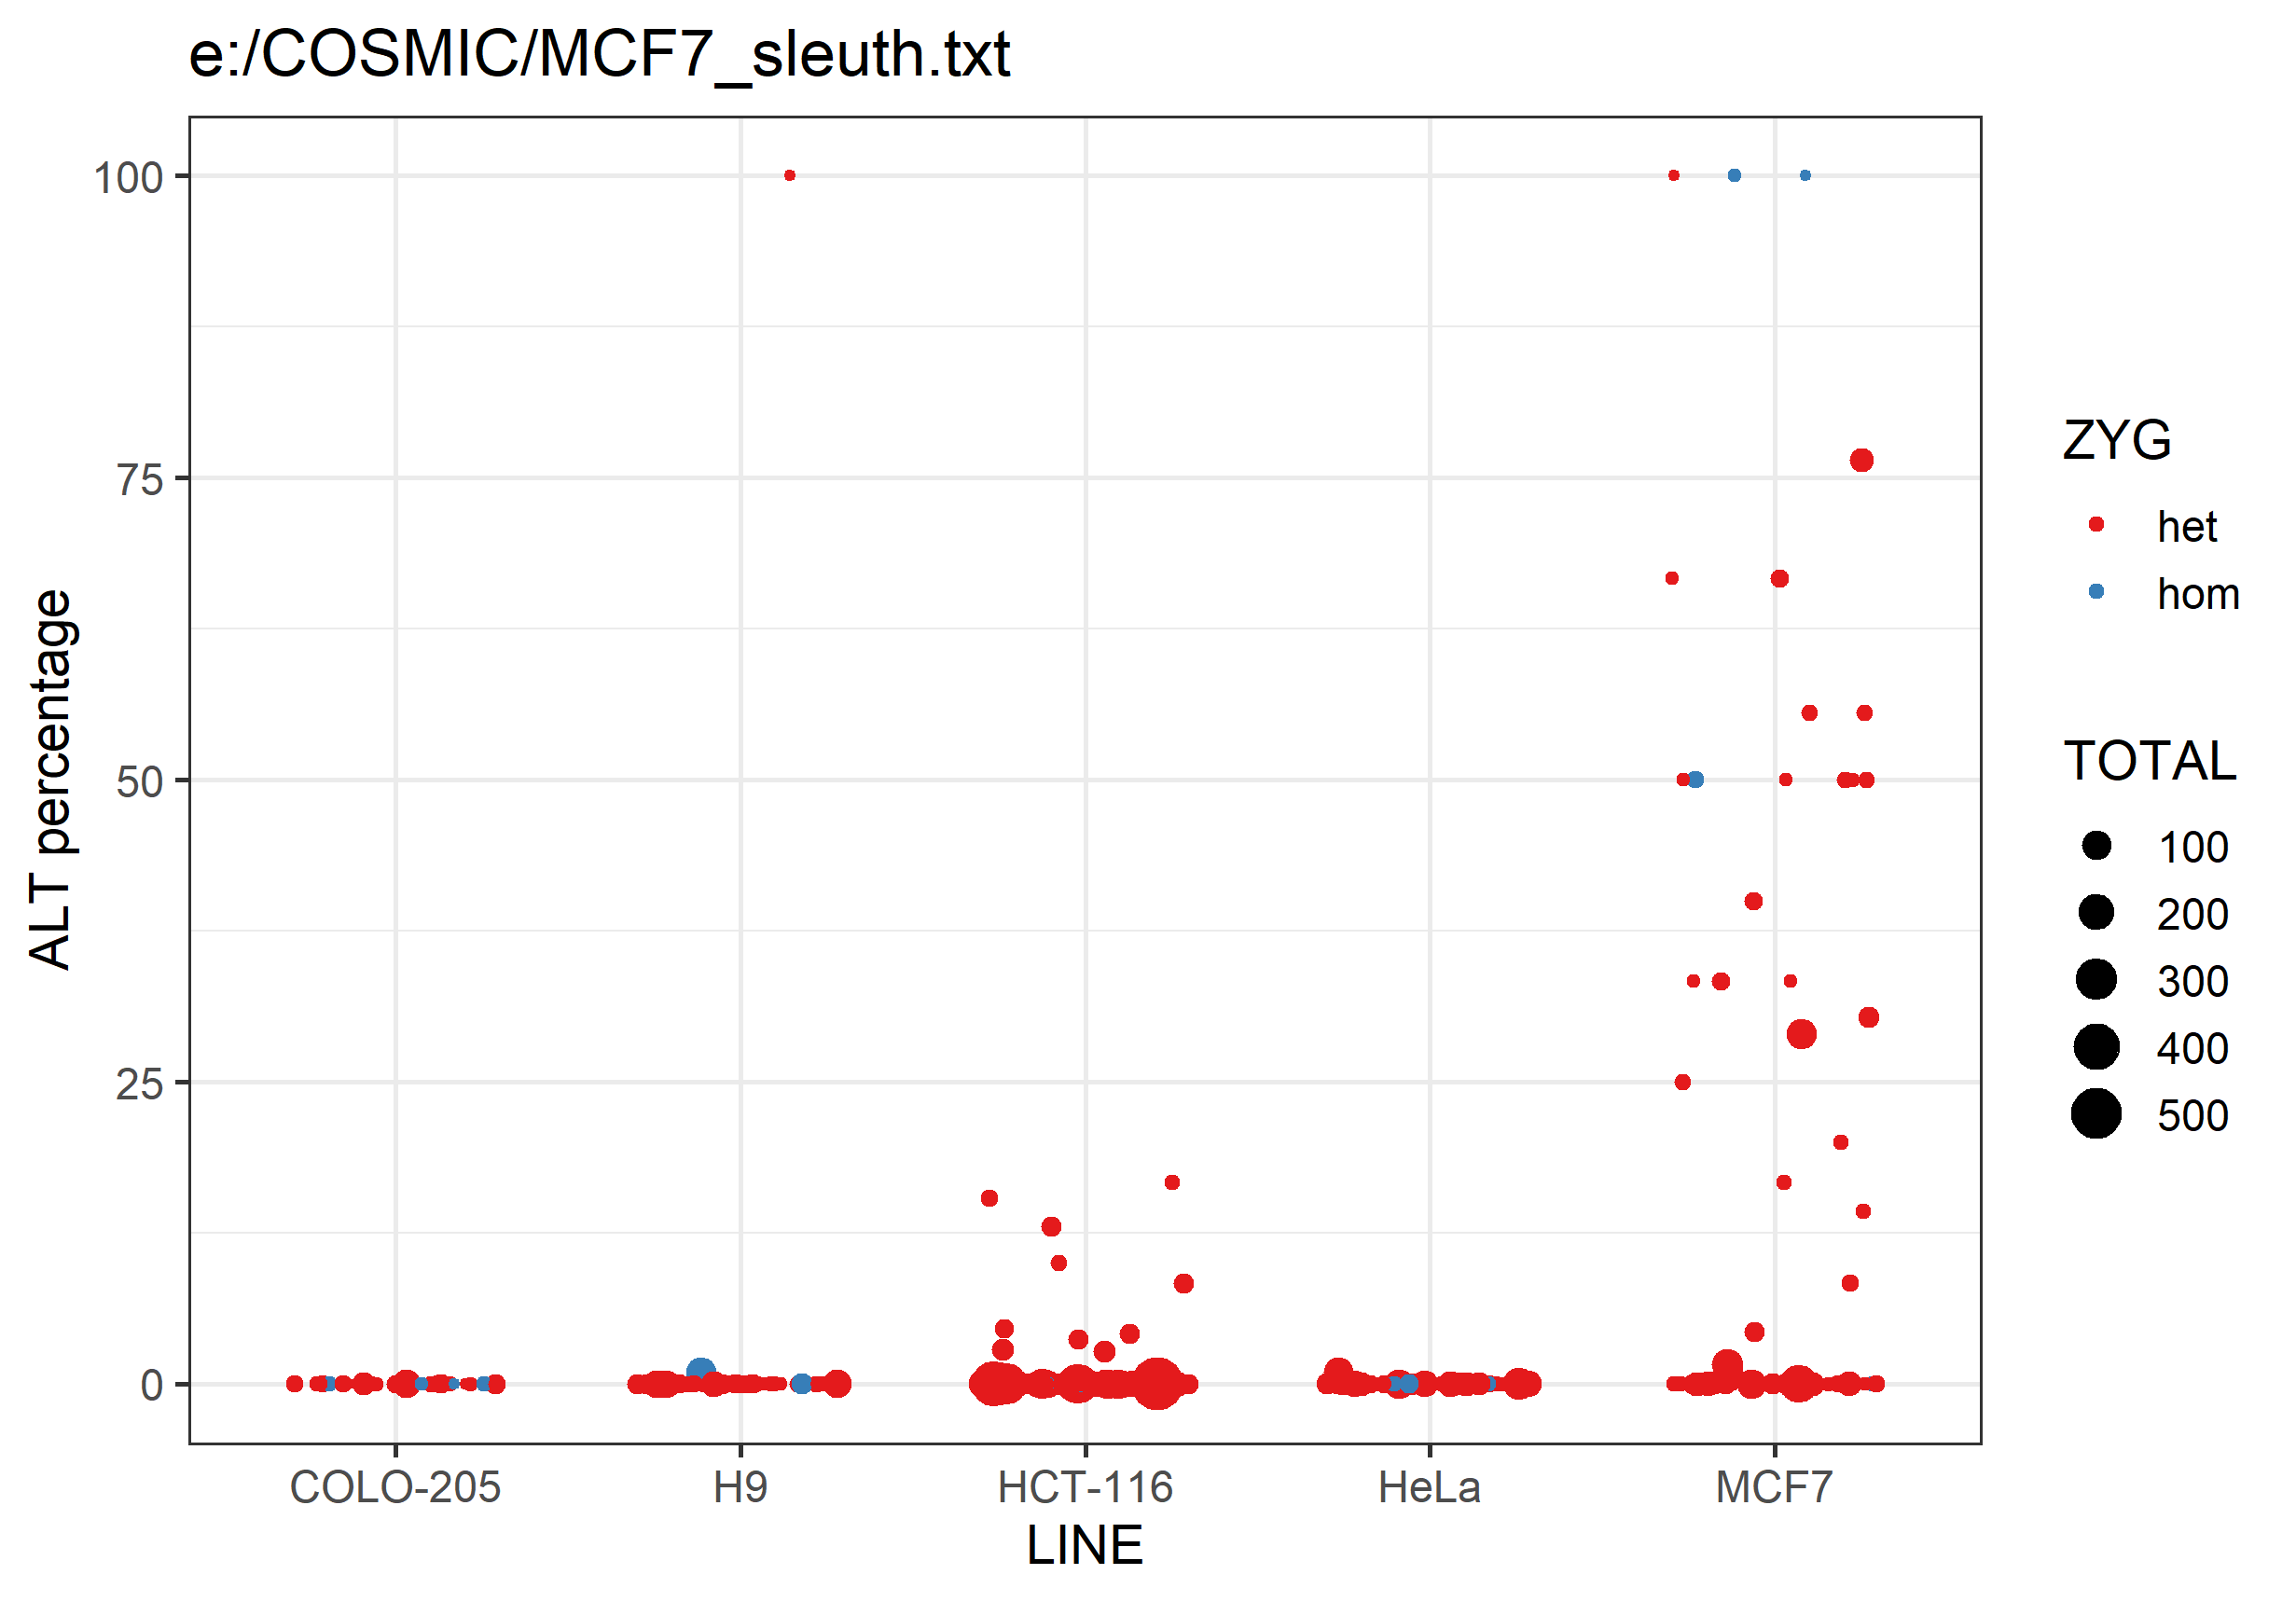
It will also generate a png graph file containing a scatterplot summarising the data in the text file. For each analysed cell line it will plot the percentage of ALT allele calls for each SNP. SNPs are coloured by whether they're expected to be heterozygous or homozygous, and the points are sized by the number of observations.
Differences between lines should hopefully be fairly obvious.
Please report any problems in our Github issue tracker or write to [email protected]


