Metrics aggregation daemon like statsd, in Go and with a bunch of extra features. (Based on code from Bitly's statsdaemon)
For a given input, this implementation yields the exact same metrics as etsy's statsd (with deleteIdleStats enabled), (though this is discouraged. See "metric namespacing" below) so it can act as a drop-in replacement. In terms of types:
- Timing (with optional percentiles, sampling supported)
- Counters (sampling supported)
- Gauges
- No histograms or sets yet, but should be easy to add if you want them
metrics 2.0 is a format for structured, self-describing, standardized metrics.
Metrics that flow through statsdaemon and are detected to be in the metrics 2.0 format undergo the same operations and aggregations, but how this is reflected in the resulting metric identifier is different:
- traditional/legacy metrics get prefixes and suffixes like the original statsd
- metrics in 2.0 format will have the appropriate adjustments to their tags. Statsdaemon assures that tags such as unit, target_type, stat, etc reflect the performed operation, according to the specification. This allows users and advanced tools such as Graph-Explorer to truly understand metrics and leverage them.
TBA.
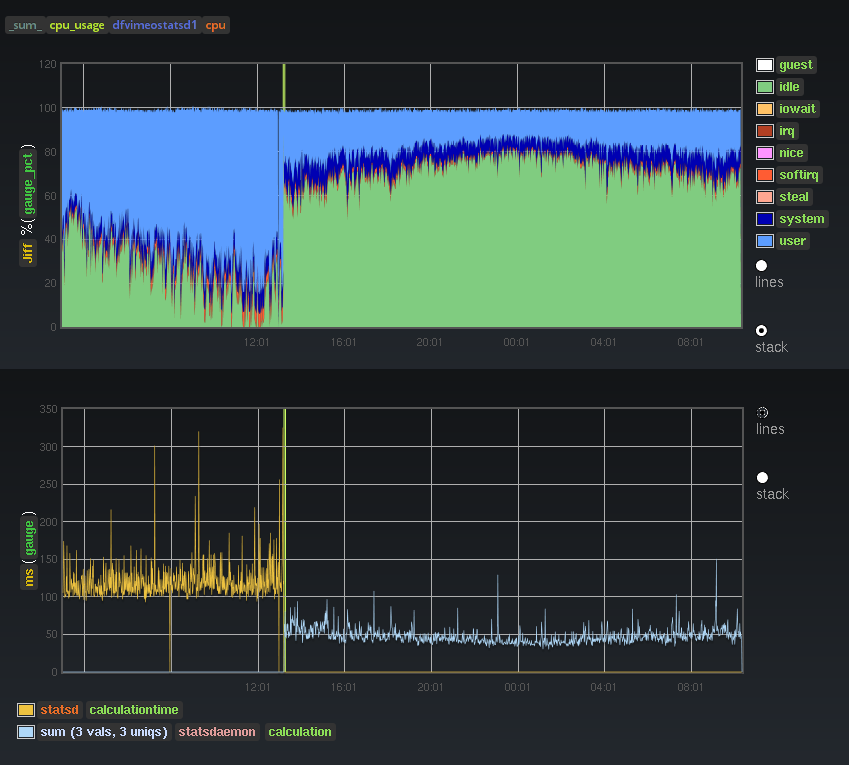
Perhaps debatable and prone to personal opinion, but people seem to agree that Go is more robust, easier to deploy and elegant than node.js. In terms of performance, I didn't do extensive or scientific benchmarking but here's the effect on our cpu usage and calculation time when switching from statsd to statsdaemon, with the same input load and the same things being calculated:
As with any statsd version, you should monitor whether the kernel drops incoming UDP packets. When statsdaemon (or statsd) cannot read packets from the udp socket fast enough - perhaps because it's overloaded with packet processing, or the udp reading is the slowest part of the chain (the case in statsdaemon) - then the udp buffer will grow and ultimately fill up, and have no more room for new packets, which get dropped, resulting in gaps in graphs. With statsdaemon this limit seems to be at around 60k packets per second. You can improve on this by batching multiple metrics into the same packet, and/or sampling more. Statsdaemon exposes a profiling endpoint for pprof, at port 6060 by default (see config).
help                             show this menu
sample_rate <metric key>         for given metric, show:
                                 <key> <ideal sample rate> <Pckt/s sent (estim)>
metric_stats                     in the past 10s interval, for every metric show:
                                 <key> <Pckt/s sent (estim)> <Pckt/s received>
peek_valid                       stream all valid lines seen in real time
                                 until you disconnect or can't keep up.
peek_invalid                     stream all invalid lines seen in real time
                                 until you disconnect or can't keep up.
wait_flush                       after the next flush, writes 'flush' and closes connection.
                                 this is convenient to restart statsdaemon
                                 with a minimal loss of data like so:
                                 nc localhost 8126 <<< wait_flush && /sbin/restart statsdaemon
Statsdaemon submits a bunch of internal performance metrics using itself. Note that these metrics are in the metrics 2.0 format, they look a bit unusual but can be treated as regular graphite metrics if you want to. However using carbon-tagger and Graph-Explorer they become much more useful.
There's also a dashboard for Grafana on Grafana.net
go get github.com/raintank/statsdaemon/cmd/statsdaemonwe use dep to save the dependencies to the vendor directory.
Usage of ./statsdaemon:
  -config_file="/etc/statsdaemon.ini": config file location
  -cpuprofile="": write cpu profile to file
  -debug=false: print statistics sent to graphite
  -memprofile="": write memory profile to this file
  -version=false: print version string
The default statsd namespace is notoriously messy so we highly recommend disabling the legacy namespace and customizing the prefixes as shown below.
listen_addr = ":8125"
admin_addr = ":8126"
graphite_addr = "127.0.0.1:2003"
flush_interval = 60

legacy_namespace = true
prefix_rates = "stats."
prefix_counters = "stats_counts."
prefix_timers = "stats.timers."
prefix_gauges = "stats.gauges."

# Recommended (legacy_namespace = false)
# counts -> stats.counters.$metric.count
# rates -> stats.counters.$metric.rate

#legacy_namespace = false
#prefix_rates = "stats.counters."
#prefix_counters = "stats.counters."
#prefix_timers = "stats.timers."
#prefix_gauges = "stats.gauges."

# prefixes for metrics2.0 metrics
# using this you can add tags, like "foo=bar.baz=quux."
# note that you should use '=' here.
# If your metrics use the '_is_' style, then we'll automatically apply the converted prefix instead.
prefix_m20_rates = ""
prefix_m20_counters = ""
prefix_m20_timers = ""
prefix_m20_gauges = ""

# send rates for counters (using prefix_rates)
flush_rates = true
# send count for counters (using prefix_counters)
flush_counts = false

percentile_thresholds = "90,75"
max_timers_per_s = 1000

