- A lightweight dynamic user mode profiler for Windows x64.
- Extremely fast. Almost no slowdown of the profiled application.
- Command Line based.
- Written in C++.
- Extremely small and hackable.
- BSD Licensed.
You don't need to make any changes to your application!
Simply make sure it's built with debug symbols and run it through silverpp like this:
silverpp.exe <PATH_TO_YOUR_APPLICATION>If you need to pass any arguments to your application run:
silverpp.exe <PATH_TO_YOUR_APPLICATION> --args these args will be passed to your applicationAfter you've performed the operations you want to profile, simply close the application.
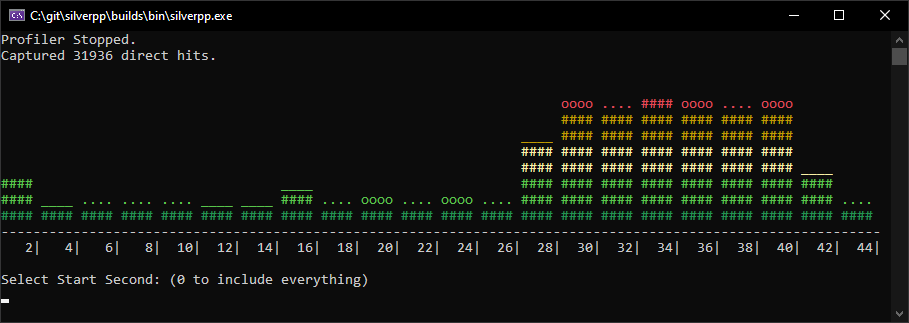
Now select the region you want to analyze.
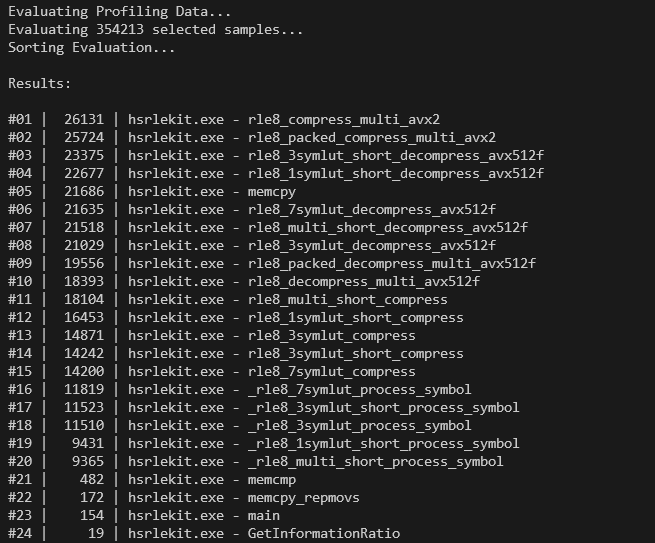
Now select the function you want to profile.
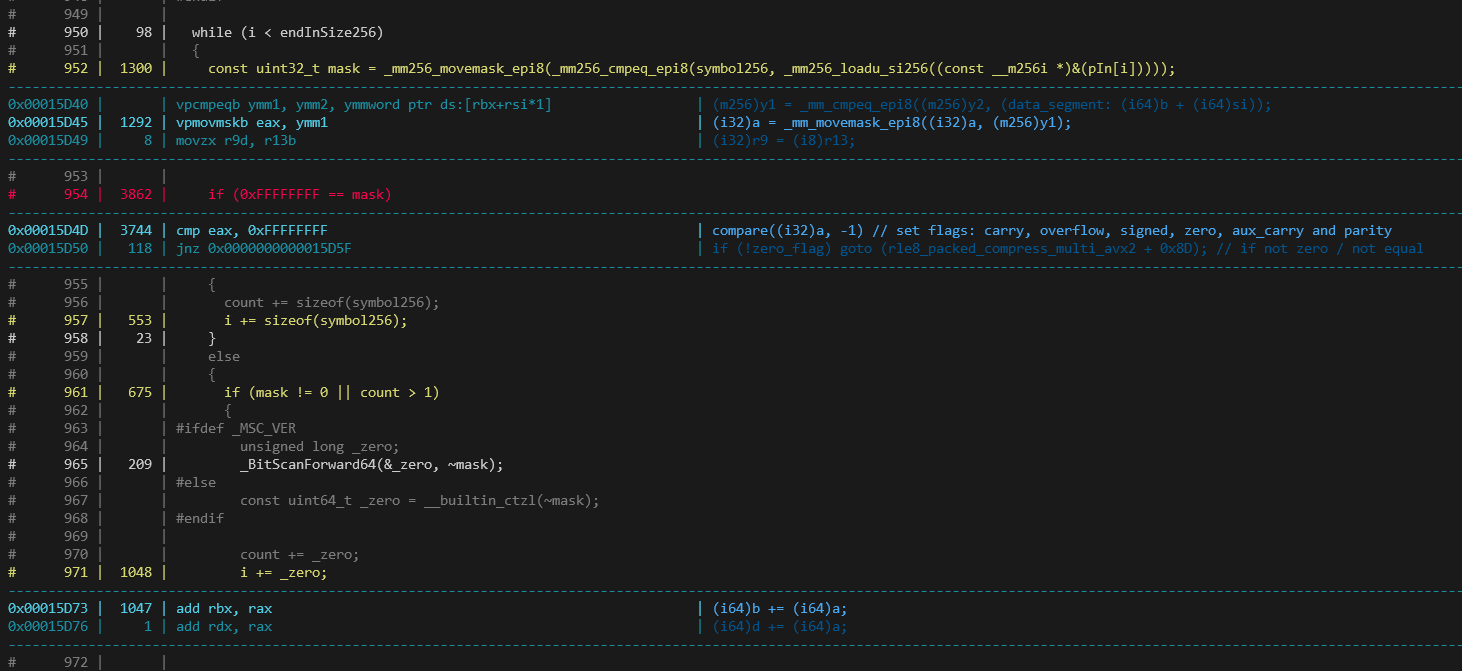
Browse through the source code with highlighted expensive lines & optional inline disassembly.
It's that simple.
Profiling sessions can be stored by simply adding --store <session_filename> to the command-line parameters. To load a stored session simply run
silverpp.exe <PATH_TO_YOUR_APPLICATION> --load <session_filename>The performance impact is very minor, since silverpp only suspends the thread it's currently examining. You'll still get lots of profiling samples because silverpp is immediately yielding the CPU as soon as it's done.
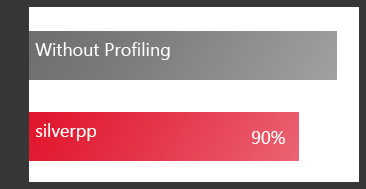
Here's a benchmark on hypersonic-rle-kit - the fastest decoding run length compression for x64.
As you can see, the performance impact is marginal at best.
I've you're not happy with the amount of samples you're getting you can switch to the --favor-accuracy mode, but be warned: It'll have a massive performance impact on your application but will retrieve about 4x the amount of samples.
No. If Visual Studio 2019 refuses to profile, you can still profile using silverpp. This is actually one of the reasons silverpp was originally created.


