-
Notifications
You must be signed in to change notification settings - Fork 1
/
index.qmd
295 lines (227 loc) · 5.68 KB
/
index.qmd
1
2
3
4
5
6
7
8
9
10
11
12
13
14
15
16
17
18
19
20
21
22
23
24
25
26
27
28
29
30
31
32
33
34
35
36
37
38
39
40
41
42
43
44
45
46
47
48
49
50
51
52
53
54
55
56
57
58
59
60
61
62
63
64
65
66
67
68
69
70
71
72
73
74
75
76
77
78
79
80
81
82
83
84
85
86
87
88
89
90
91
92
93
94
95
96
97
98
99
100
101
102
103
104
105
106
107
108
109
110
111
112
113
114
115
116
117
118
119
120
121
122
123
124
125
126
127
128
129
130
131
132
133
134
135
136
137
138
139
140
141
142
143
144
145
146
147
148
149
150
151
152
153
154
155
156
157
158
159
160
161
162
163
164
165
166
167
168
169
170
171
172
173
174
175
176
177
178
179
180
181
182
183
184
185
186
187
188
189
190
191
192
193
194
195
196
197
198
199
200
201
202
203
204
205
206
207
208
209
210
211
212
213
214
215
216
217
218
219
220
221
222
223
224
225
226
227
228
229
230
231
232
233
234
235
236
237
238
239
240
241
242
243
244
245
246
247
248
249
250
251
252
253
254
255
256
257
258
259
260
261
262
263
264
265
266
267
268
269
270
271
272
273
274
275
276
277
278
279
280
281
282
283
284
285
286
287
288
289
290
291
292
293
294
295
---
title: "Rasters.jl"
subtitle: "Geospatial raster data reading, writing and manipulation"
author:
- name: Rafael Schouten
orcid:
email: [email protected]
affiliation:
- name: Globe Intstitute, Copenhagen University
- department: Section for Biodiversity
date: "2024-07-10"
engine: julia
format:
revealjs:
theme: [simple, style.scss] # beige blood dark default league moon night serif simple sky solarized
incremental: true
toc: true
toc-depth: 1
slide-number: true
overview: true
code-line-numbers: false
highlight-style: ayu
execute:
echo: true
---
# What is a raster?
. . .
:::: {.columns}
::: {.column width="50%"}

:::
::: {.column width="50%"}
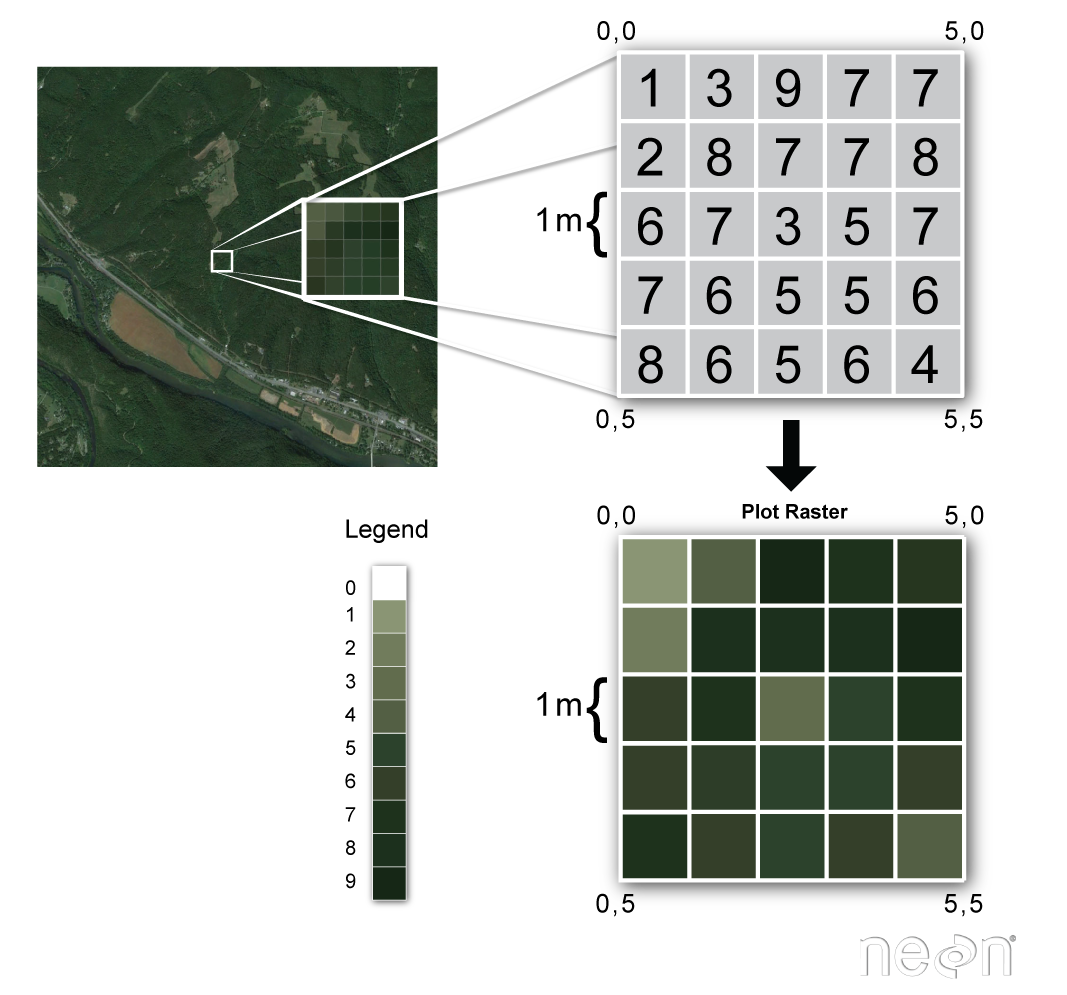
- like an image, but not RGB
- values of some variable accross a gridded space
- usually has X/Y spatial dimensions
- (e.g. lattitude/longitude)
- with a coordinate reference system
:::
::::
---
:::: {.columns}
::: {.column width="50%"}

:::
::: {.column width="50%"}
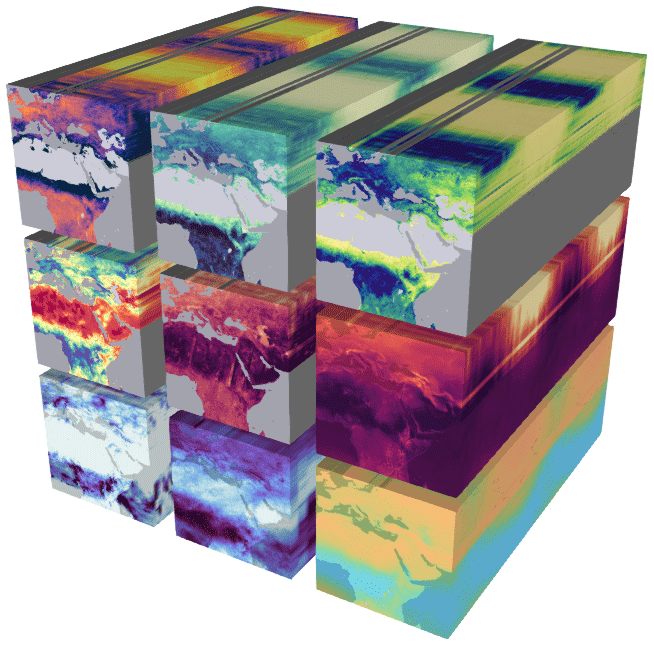
- may be collected in a dataset with multiple variables
- may have more dimensions, like time
:::
::::
# DimensionalData.jl integration
- Rasters extends DimensionalData.jl
- `Raster <: AbstractDimArray` and `RasterStack <: AbstractDimStack`
- This gives is the foundation for spatial work
- Rasters adds:
- coordinate reference systems
- missing value handling
- File IO
- GIS tools
## File Read/Write Backends
File types | Package
------------------------------- | ----------
Netcdf/hdf5 | NCDatasets.jl
Grib (read only) | GRIBDatasets.jl
Zarr (PR nearly done!) | ZarrDatasets.jl
grd (simple Mmap data from R) | native
GeoTIFF and everything else | ArchGDAL.jl
## Backend detection
Backend detected in constructors:
```julia
# Single array
rast = Raster("myraster.tif") # Will use ArchGDAL.jl
rast = Raster("myraster.nc") # Will use NCDatasets
# Multi-array
st = RasterStack("mystack.nc") # Will use NCDatasets.jl
st = RasterStack("mystack.grib") # Will use GRIBDatasets.jl
```
# DiskArrays.jl integration
For larger-than-memory data
## Lazy loading
```julia
rast = Raster(filename; lazy=true)
```
. . .
Still lazy after broadcasts:
```julia
rast10 = rast .* 10
```
. . .
Reads from disk/network only on `getindex`:
```julia
rast10[X=100 .. 135, Y=20 .. 40]
```
## Chunk patterns
For more efficient lazy reads:
\
```julia
write("rechunked.tif", mem_rast; chunks=(X(256), Y(256)))
```
## RasterDataSources.jl integration
```{julia}
#| echo: false
if !haskey(ENV, "RASTERDATASOURCES_PATH")
ENV["RASTERDATASOURCES_PATH"] = ".";
end
```
\
Load a raster from RasterDataSources.jl filename:
```{julia}
using Rasters, RasterDataSources, ArchGDAL
bioclim_filename = RasterDataSources.getraster(WorldClim{BioClim}, 5)
bioclim5 = Raster(bioclim_filename);
```
. . .
\
Or use RasterDataSources.jl syntax directly:
```{julia}
bioclim_filename = Raster(WorldClim{BioClim}, 5);
```
# Plotting
Always the right way up!
## Plots.jl
```{julia}
using Plots
Plots.plot(bioclim5)
```
## Makie.jl
```{julia}
#| echo: false
using CairoMakie
CairoMakie.activate!(type = "png")
```
```{julia}
using CairoMakie
Makie.plot(bioclim5)
```
## GeoMakie.jl
```{julia}
using GeoMakie
fig = Figure();
ga = GeoAxis(fig[1, 1]; dest="+proj=ortho +lon_0=19 +lat_0=72")
Makie.heatmap!(ga, bioclim5)
fig
```
# Common GIS methods
- for working with raster data
- for using vector/geometry data with raster data
## Native rasterization engine
- accepts all GeoInterface.jl geometries
- extremely fast + threaded
- detailed correctness warnings
- consistent behaviour and syntax for:
. . .
::: {.nonincremental}
- `rasterize`
- `coverage`
- `mask`
- `boolmask`/`missingmask`
- `zonal`
:::
## Other common methods
::: {.nonincremental}
- extract
- crop/extend
- trim
- mosaic
- aggregate
- resample
:::
# Examples
\
```{julia}
using Rasters
using ArchGDAL
using Dates
using DataFrames
using GBIF2
using NaturalEarth
using RasterDataSources
```
```{julia}
#| echo: false
using Rasters: trim
```
## `extract`
Extract climate data at specific points:
```{julia}
#| output-location: fragment
clim = RasterStack(WorldClim{BioClim})
occ = GBIF2.occurrence_search("Burramys parvus")
# occ is a table with a `:geometry` column, so this "just works"
extract(clim, occ; name=(:bio1, :bio4, :bio7)) |> DataFrame
```
## `mask` + `trim`
Mask climate rasters wth country border :
```{julia}
#| output-location: fragment
clim = RasterStack(WorldClim{Climate}, (:tmin, :tmax, :prec, :wind); month=July)
countries = naturalearth("ne_10m_admin_0_countries") |> DataFrame
finland = subset(countries, :NAME => ByRow(==("Finland"))).geometry
finland_clim = mask(clim; with=finland) |> trim
Plots.plot(finland_clim; size=(800, 400))
```
## `zonal` statistics
```{julia}
#| echo: false
using Rasters, RasterDataSources, ArchGDAL, Dates, DataFrames, NaturalEarth, Statistics
```
Find the hottest and coldest countries in July:
```{julia}
#| output-location: fragment
clim = Raster(WorldClim{Climate}, :tmax; month=July)
countries = naturalearth("ne_10m_admin_0_countries") |> DataFrame
countries.july_maxtemp = zonal(Statistics.mean, clim;
of=countries, boundary=:touches, progress=false
)
filtered = subset(countries, :july_maxtemp => ByRow(!isnan))
sort!(filtered, :july_maxtemp).NAME
```
## Thanks
Especially to Rasters.jl contributors!

\
Any problems, make github issues at\
https://github.com/rafaqz/Rasters.jl
\
\
(Please include all files in a MWE!)