Skip to content
New issue

Have a question about this project? Sign up for a free GitHub account to open an issue and contact its maintainers and the community.

By clicking “Sign up for GitHub”, you agree to our terms of service and privacy statement. We’ll occasionally send you account related emails.

Already on GitHub? Sign in to your account

Observer look angles are incorrect for SEVIRI #68

Open
simonrp84 opened this issue Oct 28, 2020 · 9 comments
Open

Observer look angles are incorrect for SEVIRI #68

simonrp84 opened this issue Oct 28, 2020 · 9 comments

Comments

@simonrp84
Copy link
Member

simonrp84 commented Oct 28, 2020

Code Sample, a minimal, complete, and verifiable piece of code

Combining satpy and pyorbital:

from satpy import Scene
from pyorbital.orbital import get_observer_look
import matplotlib.pyplot as plt

# Load SEVIRI native file
scn = Scene(['./IN/MSG1-SEVI-MSG15-0100-NA-20190821091242.039000000Z-NA.nat'], reader='seviri_l1b_native')
scn.load(['VIS006'])

# Get some data about the scene
scn_area = scn['VIS006'].attrs['area']
sat_lat = 0.0
sat_lon = scn_area .proj_dict['lon_0']
sat_alt = scn_area .proj_dict['h'] / 1000.

scn_time = scn.start_time

# find the lons / lats for the scene
scn_lons, scn_lats = scn_area.get_lonlats(chunks=(1000, 1000))

# Compute viewing geometry
view_azi, view_el = get_observer_look(sat_lon, sat_lat, sat_alt, scn_time, scn_lons, scn_lats , 0.)

# Plot the results
plt.subplots(1, 1, figsize=(14, 14))
plt.imshow(view_azi)

Problem description

The above code (for a Met-8/SEVIRI IODC scene) produces an odd line along the equator in which the azimuth angles are incorrect:
image

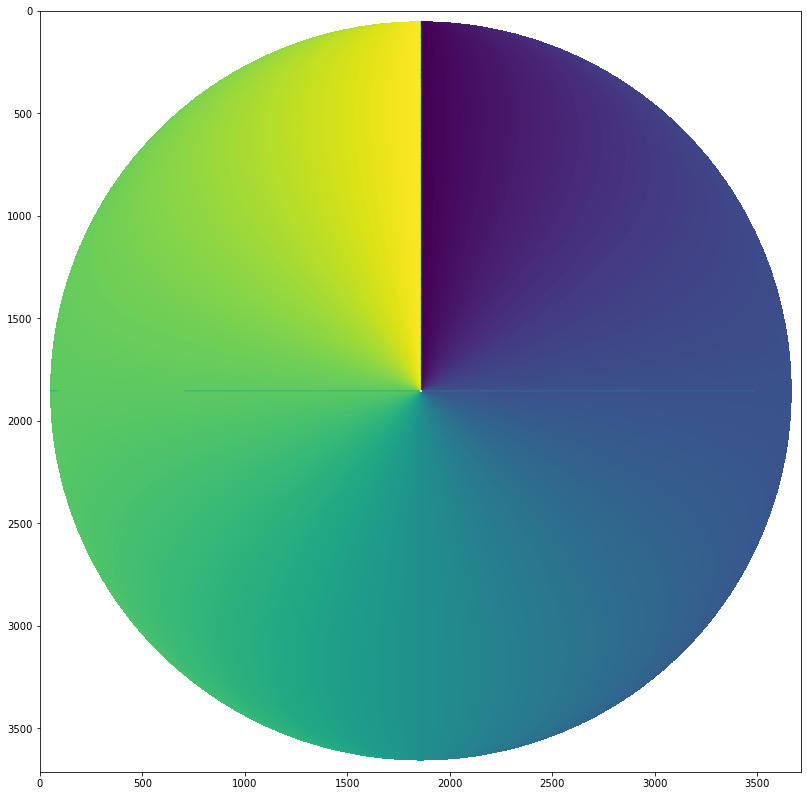
This line should not be present, and is not present - for example - in the similar routine for finding solar azimuth (pyorbital.astronomy import get_alt_az).

Expected Output

No line along the equator

Actual Result, Traceback if applicable

See picture above.

Versions of Python, package at hand and relevant dependencies

Satpy: Master from github (28th Oct 2020)
Pyorbital: 1.6.0

@simonrp84
Copy link
Member Author

simonrp84 commented Oct 28, 2020

Printing the azimuths along the equator print(view_azi[::50,1855].compute()) gives this:
[ nan 360. 360. 360. 360. 360. 0. 0. 0. 0. 0. 0. 0. 360. 360. 360. 360. 0. 0. 360. 360. 360. 360. 0. 360. 0. 0. 360. 360. 0. 0. 0. 360. 0. 360. 0. 360. 360. 180. 180. 180. 180. 180. 180. 180. 180. 180. 180. 180. 180. 180. 180. 180. 180. 180. 180. 180. 180. 180. 180. 180. 180. 180. 180. 180. 180. 180. 180. 180. 180. 180. 180. 180. 180. nan]

Which is incorrect. The values should be 90 or 270.

Reversing the order of the arguments products no line along the equator, although of course the values are not correct as we're now looking at the satellite look angles rather than the observer look angles:
view_azi, view_el = get_observer_look(scn_lons, scn_lats , 0., scn_time, sat_lon, sat_lat, sat_alt)

@sfinkens
Copy link
Member

@ninahakansson might be interested in this, too :)

@mraspaud
Copy link
Member

@simonrp84 can you produce a minimal example that exhibits the error without relying on a data file? That way we would have something to test against.

@ninahakansson
Copy link

@simonrp84 Should it not be print(view_azi[1855, ::50].compute()) to look at the corrupted data (line 1855, not column 1855)?

I tried to replicate this bug using latest pyorbital and satpy as well as with pyorbital = 1.6.0 and satpy 0.24.0. I used an old SEVIRI file (MSG2-SEVI-MSG15-0201-NA-20070912105742.738000000Z-20110623023936-1431340.nat) but I could not create any strange values. So I am not sure if PR #77 fixes this problem or not.

@simonrp84
Copy link
Member Author

simonrp84 commented May 24, 2021

@ninahakansson Sorry, yes it should be print(view_azi[1855, ::50].compute()).

The bug is still in the latest conda versions. It seems for line 1855 the azimuths are reversed.

for i in range(1854, 1857):
    print(i, np.round(view_azi[i, ::250].compute()))

Gives:

1854 [ nan 270. 270. 270. 270. 270. 270. 271.  90.  90.  90.  90.  90.  90.  90.]
1855 [ nan  90.  90.  90.  90.  90.  90.  90. 270. 270. 270. 270. 270. 270. 270.]
1856 [ nan 270. 270. 270. 270. 270. 270. 269.  90.  90.  90.  90.  90.  90.  90.]

@mraspaud Not sure if I edited my issue after your comment, but the first post does contain a minimum reproducable example.

Also, I just tested this with the latest pyorbital master, same issue still occurs.

@ninahakansson
Copy link

@simonrp84 I used your example but with another file MSG2-SEVI-MSG15-0201-NA-20070912105742.738000000Z-20110623023936-1431340.nat. And I got the correct angles (except for no nan outside the disc?). So maybe it is an issue only for MSG1?

1854 [256. 270. 270. 270. 270. 270. 270. 271.  89.  90.  90.  90.  90.  90.
 90.]
1855 [256. 270. 270. 270. 270. 270. 270. 270.  90.  90.  90.  90.  90.  90.
 90.]
1856 [256. 270. 270. 270. 270. 270. 270. 270.  90.  90.  90.  90.  90.  90.
 90.]

@ninahakansson
Copy link

Does the lat/lon look correct and not reversed for the 1855 line?

@simonrp84
Copy link
Member Author

Yes, the lats/lons look OK. Lats are all zero, lons are:

1854 [ inf  55.  42.  32.  24.  17.  10.   3.  -4. -11. -18. -25. -34. -44. -57.]
1855 [ inf  55.  42.  32.  24.  17.  10.   3.  -4. -11. -18. -25. -34. -44. -57.]
1856 [ inf  55.  42.  32.  24.  17.  10.   3.  -4. -11. -18. -25. -34. -44. -57.]

I've tested this with both MSG1 and MSG4 data, the same problem exists in both (numbers above are MSG4).

@simonrp84
Copy link
Member Author

In case it's any help, the satpy version is 0.27.1.dev73+g91494305.d20210510 and pyorbital is 1.6.1+1.g91794a6 to generate the above plots / data.

Sign up for free to join this conversation on GitHub. Already have an account? Sign in to comment
Labels
None yet
Projects
None yet
Development

No branches or pull requests

4 participants