Preprint available on biorxiv.
Visualisation of top gene-phenotype relations can be found at https://phenogenon.phenopolis.org/
Phenogenon is a method that discover gene to HPO associations from:
- Human Phenotype Ontology annotated patients
- gnomAD for estimating rare variant population frequency
- CADD for variant pathogenicity prediction.
The HGF data published on the 3288 whole exomes can be found in data/hgf.August.2017.csv
Given:
- a genotype vcf file (such as
tests/data/ABCA4.anonymised.vcf.gz) - a list of unrelated individuals (such as
tests/data/test_unrelated.tsv) - HPO dictionary (such as
tests/data/new-hpo-hpo.json) - a CADD score file (such as
tests/data/CADD_ABCA4_SCN1A.vcf.gz) - a patient-hpo file (such as
tests/data/test_patients_hpo_snapshot.tsv)
Phenogenon is able to uncover known gene to phenotype relations, such as:
- "ABCA4 – Macular dystrophy"
- "SCN1A – Seizures".
Additionally, it accurately infers mode of inheritance (moi), such as:
- recessive mode of inheritance in the case of the "ABCA4 – Macular dystrophy"
- dominant mode of inheritance with the "SCN1A – Seizures" relationship."
External programs you need to install:
- tabix
- bcftools
- (optional) orca for drawing heatmap (refer to https://plot.ly/python/static-image-export/)
python setup.py installIt is also possible to run Phenogenon with Docker
# After starting the docker daemon:
docker pull phenopolis/phenogenon:latest
docker run -v $(pwd -P):/phenogenon -it phenogenon:latest bash
You can also build a docker image from this repository with the following command:
docker build -t phenogenon .Running phenogenon -h will display the following help text
$ phenogenon -h
Usage: phenogenon [options] --vcf_file [FILE] --range [CHR:START-END] --output [FILE]

Options:
  -h, --help            show this help message and exit
  --output=OUTPUT       The path to the output file
  --vcf_file=VCF_FILE   The path to the input VCF file (must be bgzipped and
                        tabix-indexed)
  --range=RANGE         Genome location of gene to analyse e.g. 2:4000-6000
  --config_file=CONFIG_FILE
                        The path to the config file
The genomic range is usually a gene, which can be retrieved from an ensembl gtf file.
Note please use human reference build version b37, as this is the version supported by both gnomAD (gnomAD now also supports hg38) and CADD.
The vcf file should include all the samples that would be tested in Phenogenon. In order to index the file, please ensure it is sorted by both chromosomes and locations.
bgzip -c 1.vcf > 1.vcf.gz && tabix -p vcf 1.vcf.gz
Parameters of Phenogenon are set in configure.cfg in the root folder.
It has detailed explanations in comments.
Run Unit test:
coverage run --omit=*/site-packages/*,*/tests/* -m unittest discover -s testsphenogenon --range 1:94458394-94586689 --vcf_file tests/data/ABCA4.anonymised.vcf.gz --output ABCA4.test.jsonProduces ABCA4.test.json.
Explanation of JSON output:
{
  "friendly_result": {
    ##################
    # primary result #
    ##################
    # "recessive": recessive moi, "dominant": dominant moi
    # this is the goodness of fit score. It only reports the highest scoring HPOs.
    "hgf": {
      "recessive": {
        "Macular dystrophy": 10.293977466877369
      },
      "dominant": {
        "Macular dystrophy": 12.581133080136787
      }
    },
    # We found that cadd_15_ratio [0,1] correlates age of onset.
    # The closer cadd_15_ratio is to 1, the more likely the HPO is early onset.
    # In essence, it looks at how effective (relatively) variants with CADD phred score >=15 contribute to hgf
    # 1: very effective; 0: not at all!
    "cadd_15_ratio": {
      "recessive": {
        "Macular dystrophy": 0.8851477859029983
      },
      "dominant": {
        "Macular dystrophy": 0.9594599287088905
      }
    },
    # Mode of inheritance, derived from MOI_score
    "MOI": "recessive",
    # MOI_score > 0: recessive; MOI_score < 0: dominant
    "MOI_score": 0.8872573775123538,

    ##########################
    # Supportive information #
    ##########################
    # pop_alert look at per moi per HPO level.
    # it reports if certain POP specific variants are predominantly enriched in a group with moi/HPO
    "pop_alert": {
      "recessive": {
        # e.g. we found patients with recessive/HP:0004329 tend to carry variants v1,v2,v3,v4
        # and v1,v2,v3,v4 seem to have a Jewish descent (inferred from gnomad), it then raises a
        # ASJ flag.
        "Abnormality of blood and blood-forming tissues": ["AFR"],
        "Abnormality of the retina": ["ASJ"],
        "Abnormal eye morphology": ["ASJ"],
        "Abnormality of the globe": ["ASJ"],
        "Abnormality of the fundus": ["ASJ"],
        "Abnormality of the eye": ["ASJ"],
        "Abnormal eye physiology": ["NFE"],
        "Abnormality of multiple cell lineages in the bone marrow": ["AFR"],
        "Retinal dystrophy": ["ASJ"],
        "Abnormality of bone marrow cell morphology": ["AFR"],
        "Abnormality of the posterior segment of the globe": ["ASJ"]
      },
      "dominant": {
        "Abnormality of the mitochondrion": ["OTH"],
        "Abnormality of the macula": ["NFE"],
        "Abnormality of the integument": ["EAS"],
        "Abnormality of cell physiology": ["OTH"],
        "Macular dystrophy": ["NFE"],
        "Abnormality of vision": ["SAS"],
        "Abnormality of metabolism/homeostasis": ["OTH"]
      }
    },
    # number of patients found to carry at least two variants ("recessive") and at least one variant ("dominant")
    "number_of_patients": {
      "recessive": 51,
      "dominant": 187
    }
  },
  "result":{... # HPO code instead of HPO name}
}phenogenon --range 2:166845571-166930215 --vcf_file tests/data/SCN1A.anonymised.vcf.gz --output SCN1A.test.jsonExplanation of JSON output:
{
  "friendly_result":{
    "hgf": {
      "recessive": {
        "Abnormality of the mitochondrion": 1.2849541828056956,
        "Seizures": 2.514407022516984
      },
      "dominant": {
        "Seizures": 74.66686039643339
      }
    },
    "MOI": "dominant",

    "cadd_15_ratio": {
      "recessive": {
        "Abnormality of the mitochondrion": 0,
        "Seizures": 1
      },
      "dominant": {
        "Seizures": 0.9860913529587728
      }
    },
    "MOI_score": -67.76587193983218,
    "pop_alert": {
      "recessive": {},
      "dominant": {}
    },
    "number_of_patients": {
      "recessive": 11,
      "dominant": 108
    }
  },
  "result":{...}
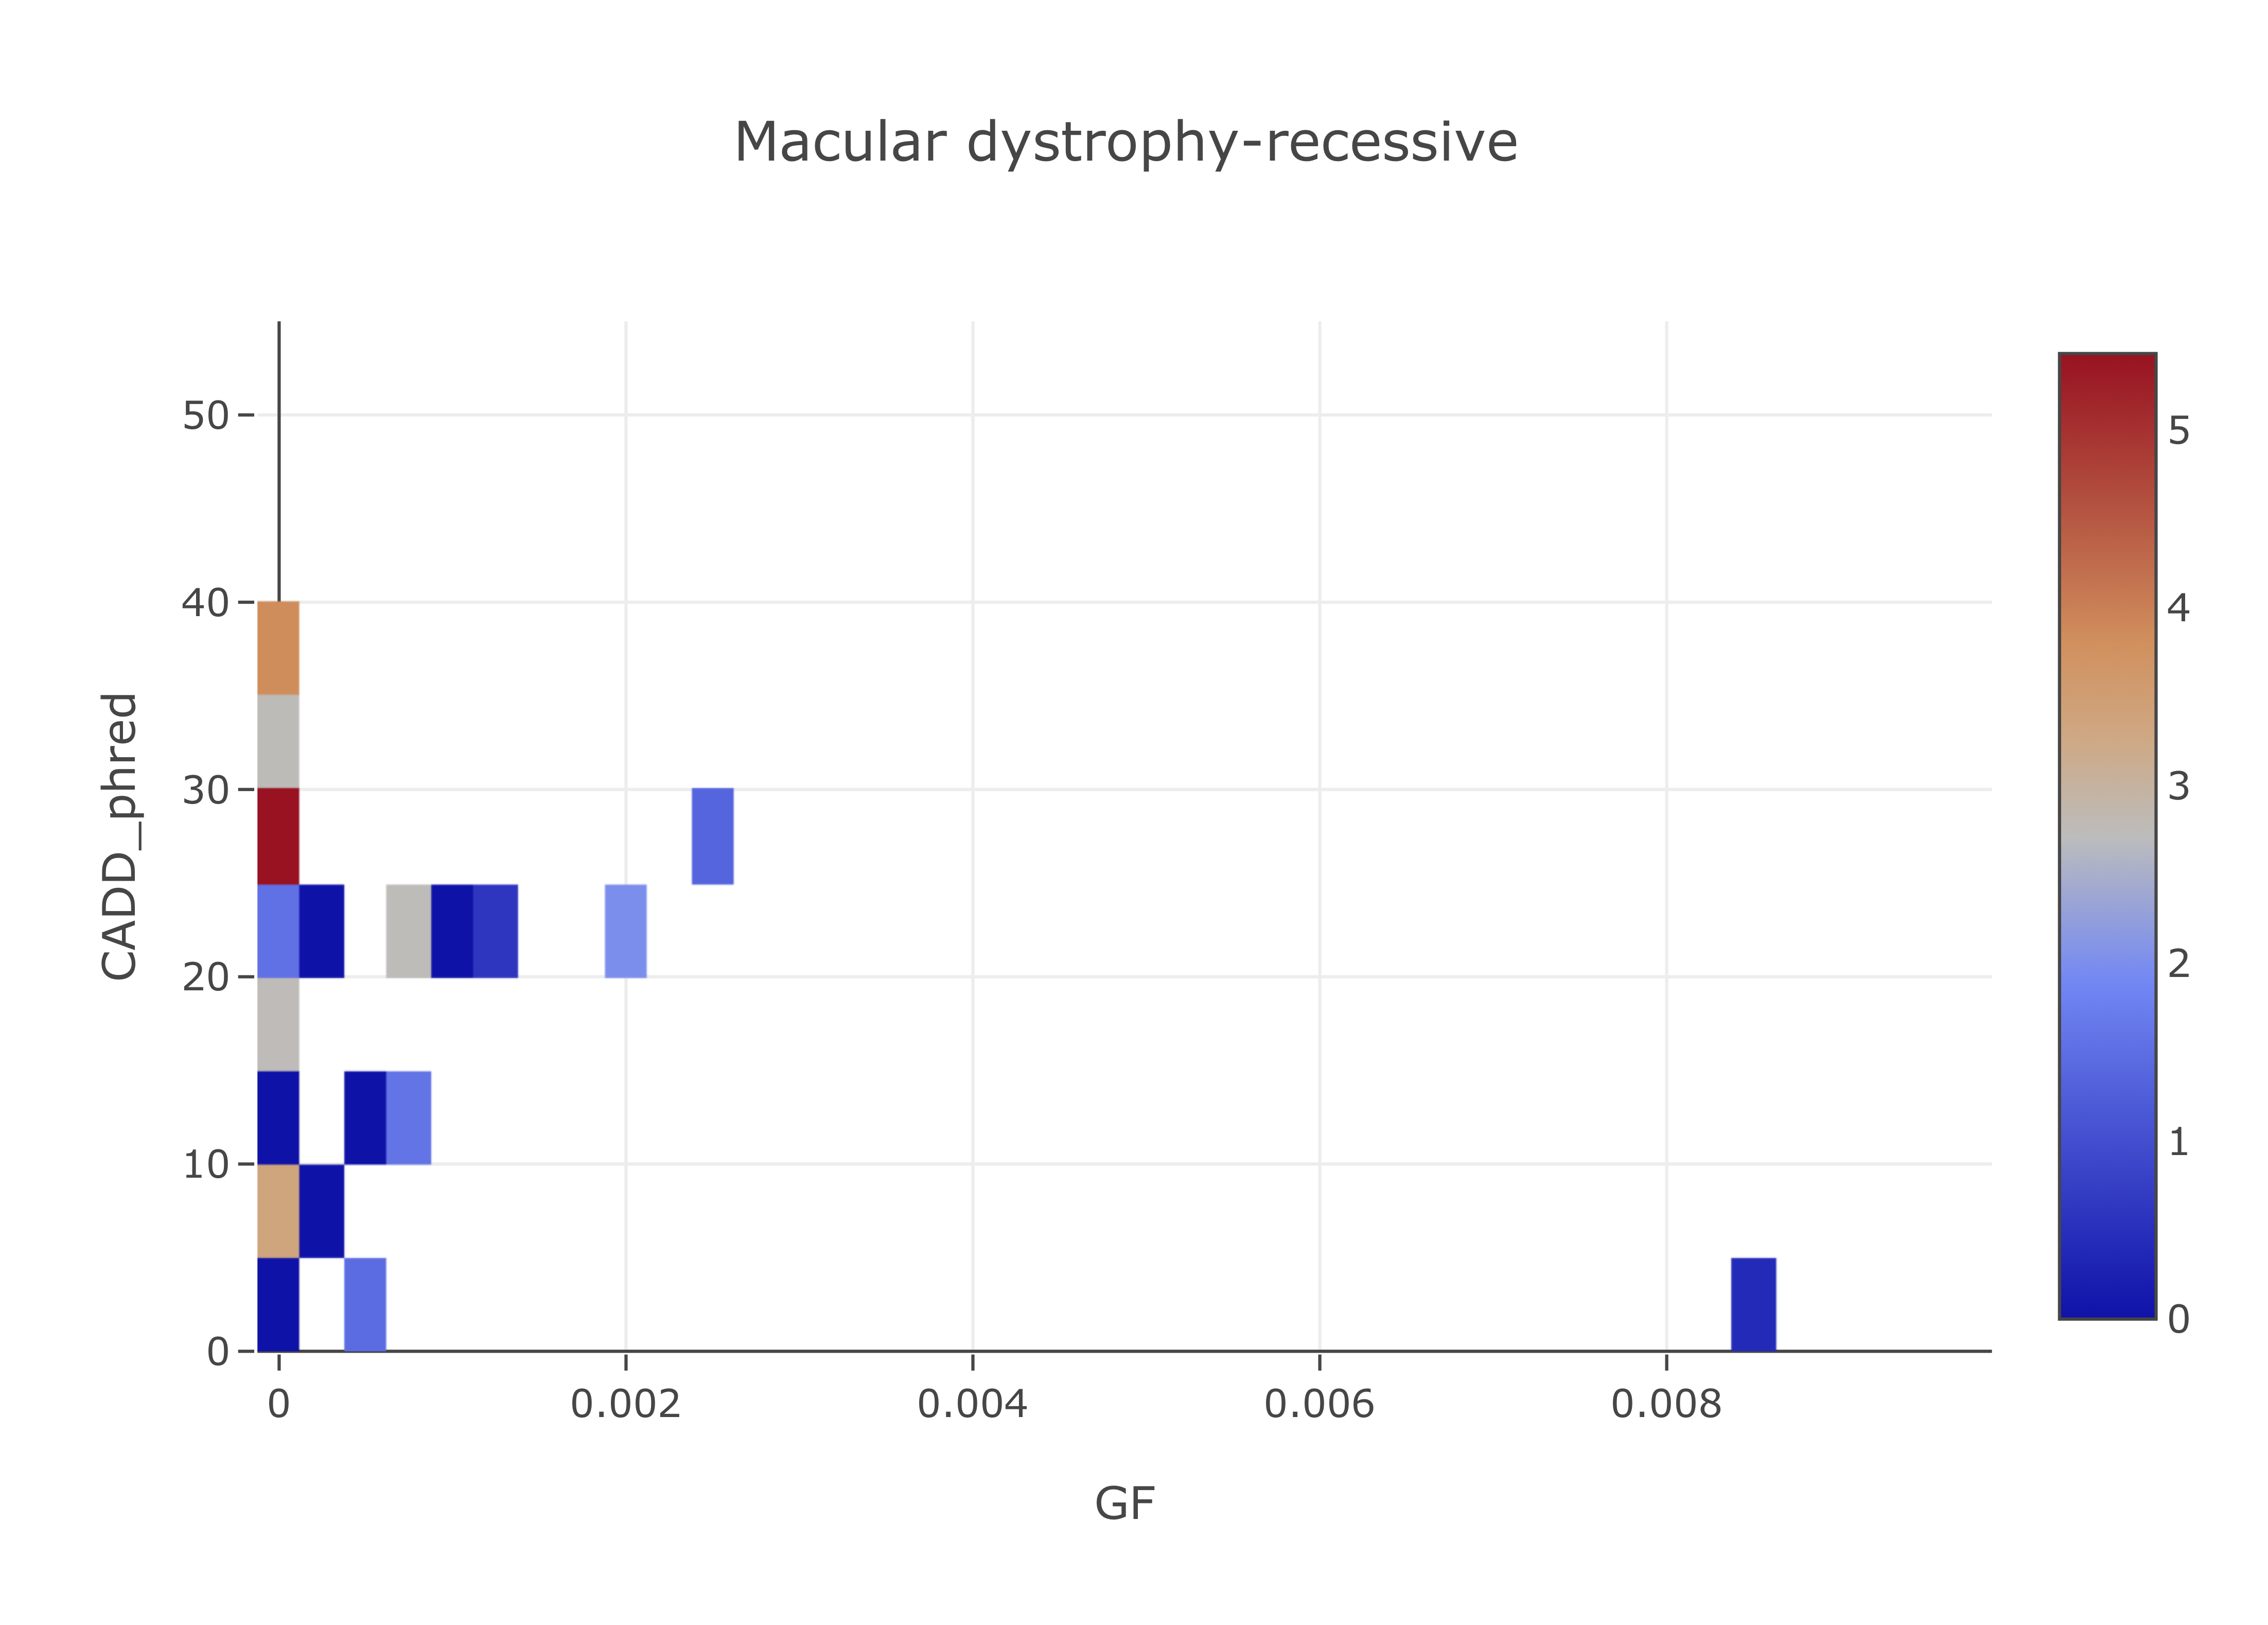
}You can opt to draw Phenogenon heatmaps (using plotly as shown in the paper), by specifying --heatmap_outdir. It will output images in pdf format.
phenogenon --range 1:94458394-94586689 --vcf_file tests/data/ABCA4.anonymised.vcf.gz --output ABCA4.test.json --heatmap_outdir output/heatmap/ABCA4