forked from DonJayamanne/pythonVSCode
-
Notifications
You must be signed in to change notification settings - Fork 1.2k
Profiling
Rich Chiodo edited this page Apr 12, 2019
·
7 revisions
If you find yourself with the need to profile the extension, here's some steps you can take to get a usable profile:
- npm install -g vsce <- This is the vscode extension packager. It needs to be global
- npm run package <- This will generate a vsix of your development bits
- Close VS code
- Navigate to your user/.vscode/extensions directory
- Delete all ms-python directories there.
- Open VS Code and run the 'Install From VSIX' command to install the vsix you just generated.
This gets your bits (and only your bits) installed as a package inside of VS Code without having to run the debugger.
The next step is to make those bits non-minified.
- npm run clean <- This will clean your output directory
- npm run compile
- npm run compile-webviews
- Copy the 'out' directory from your source code overtop of the 'out' directory in your user/.vscode/extensions/ms-python directory
- Copy the 'node_modules' directory from your source next to the 'out' directory in your user/.vscode/extensions/ms-python directory. This might take a while.
Now you have debug bits installed.
Follow the directions here: https://github.com/Microsoft/vscode/wiki/Performance-Issues#profile-the-running-extensions
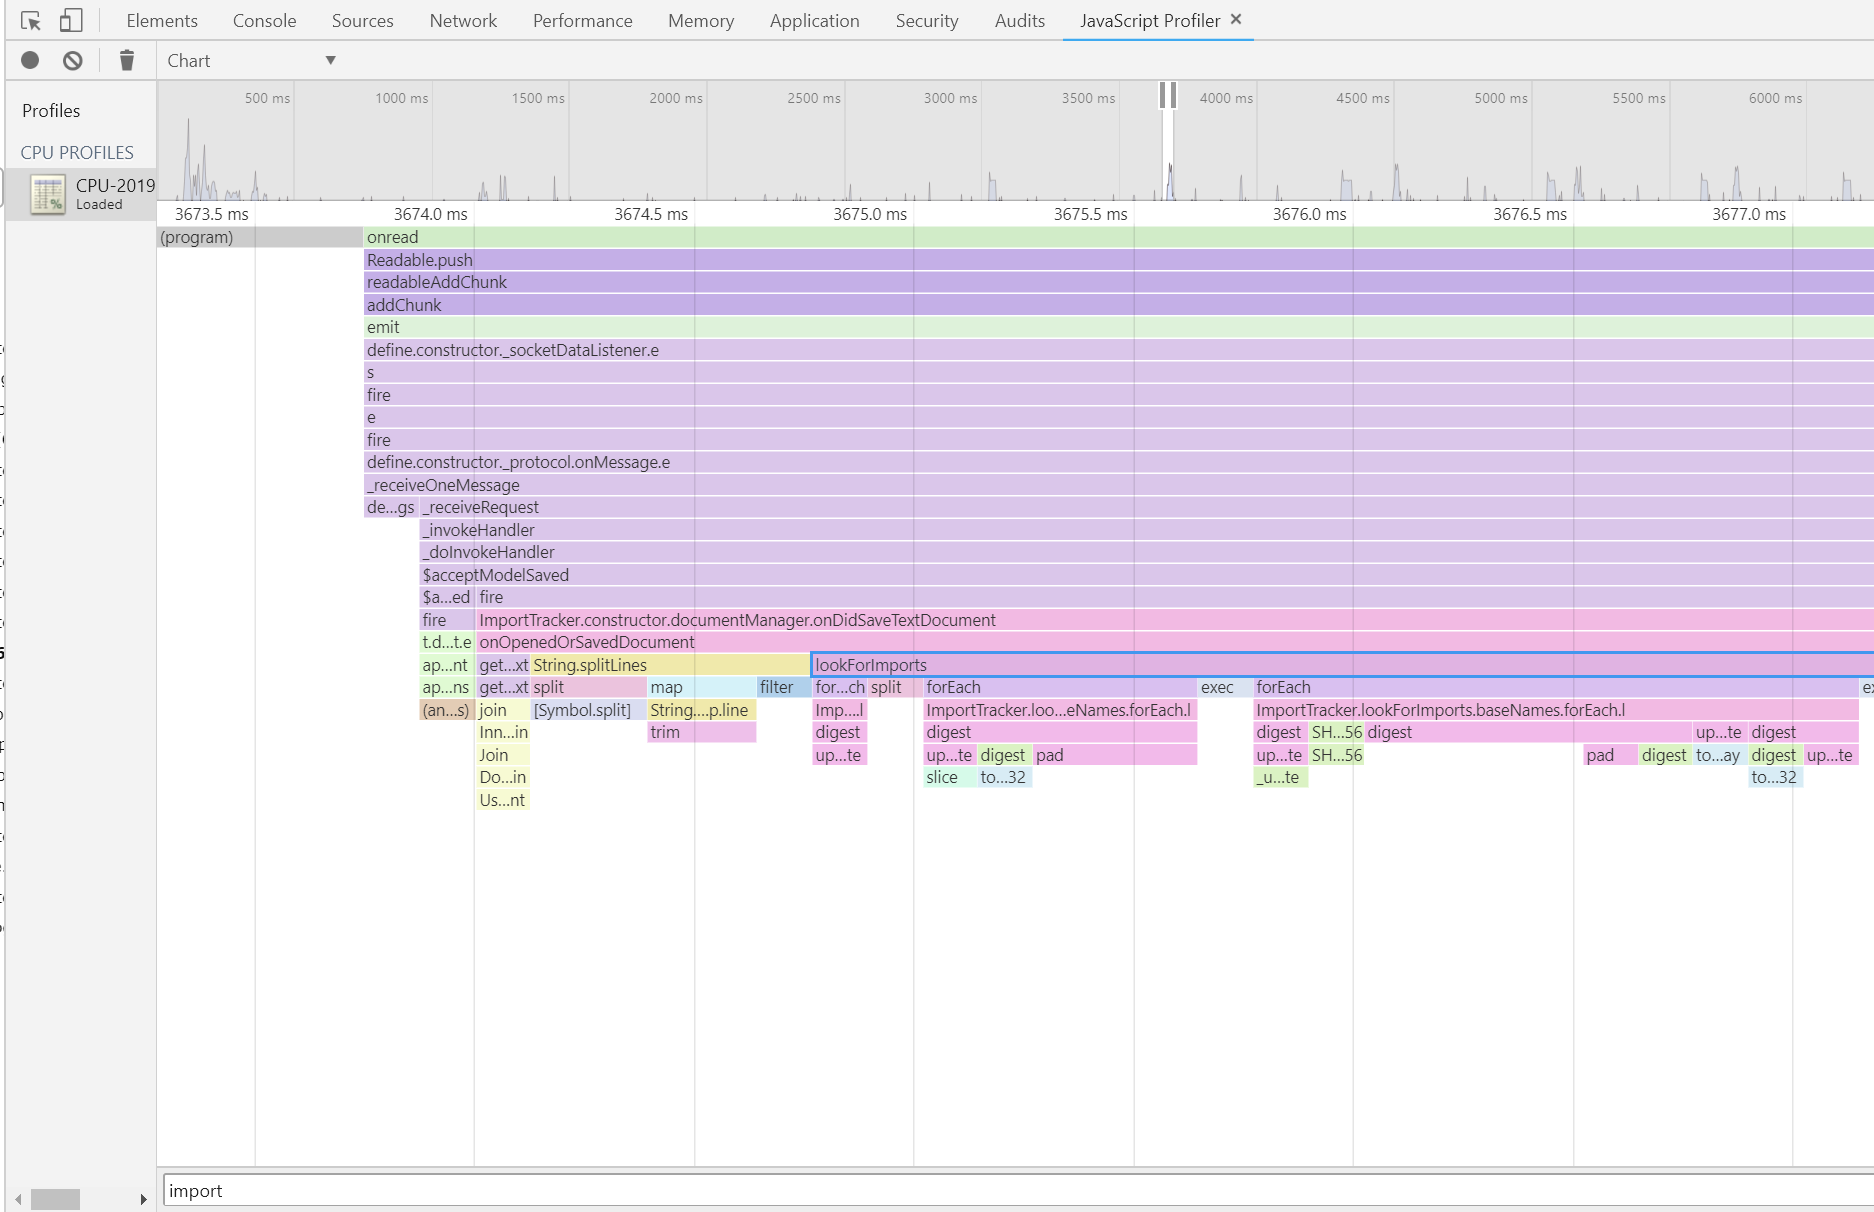
You should generate a profile and save it. You can then load it into any Chrome javscript profiler and look at the results.
I found using the 'Chart' view and searching (CTRL+F) for classes/functions I thought might be expensive was a good way to start:
