English | 简体中文
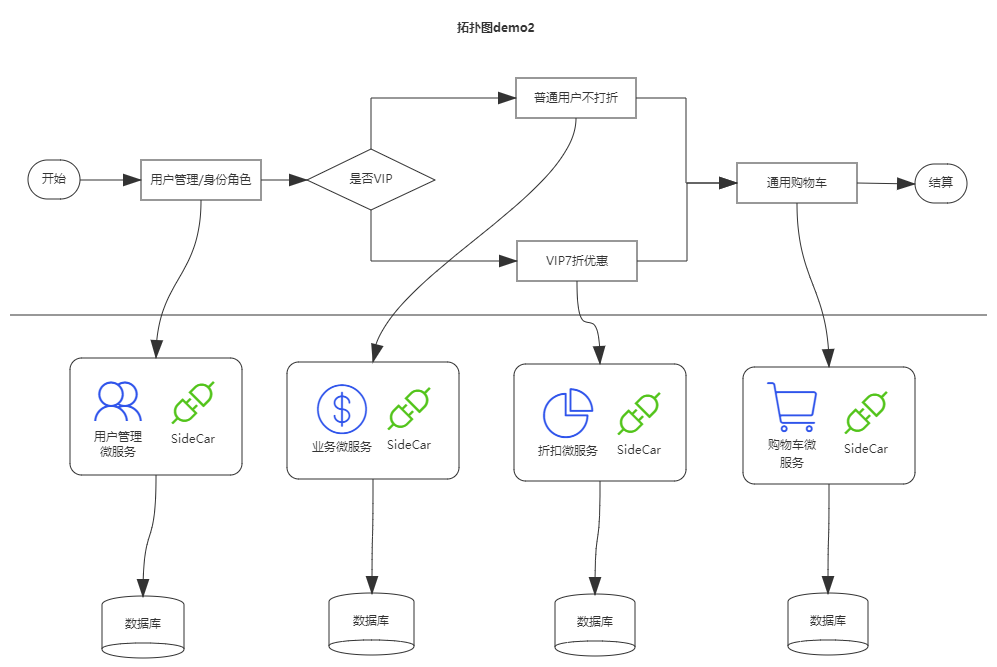
Le5le-topology 是一个可视化在线绘图工具,使用 Canvas + Typescript。支持 topology, UML、微服务架构、动态流量、SCADA 场景等。
- 极易扩展 - 程序员可以以中间件方式编写自己的图表。框架实现了拖曳、缩放、旋转、自定义属性等基础操作,开发者只用关心图表绘画实现即可。
- 流畅、高性能 - 使用 canvas 和多个场景离屏,操作过程流畅;完全不用担心 SVG 方式 dom 元素过多,性能高效。
- 动画
- TypeScript
- libs
  |- topology  // topogoly-core库源码
- src  // 官网源码.
- bundle // es5的压缩包和demo
- demo // demo
import { Topology } from 'topology-core';

var canvas = new Topology('topo-dom', options);
canvas.open(data);
<script src="/bundle/topology.bundle.js"></script>

var canvas = new Le5leTopology.Topology('topo-canvas', {});
canvas.open(data);
[Todo]
编译在线绘图官网 前端源码
$ yarn
$ npm start

# build
$ npm run build
$ yarn

//【注意】 修改host文件,把local.dev.le5le.com代理到127.0.0.1
$ npm run dev
$ yarn

//【注意】 修改host文件,把local.le5le.com代理到127.0.0.1
$ npm run prod
[libs/topology#] yarn

# build
[libs/topology#] npm run build
[libs/topology-flow-diagram#] yarn

# build
[libs/topology-flow-diagram#] npm run build
demo 源码
[demo#] yarn or npm install

# build
[demo#] npm run build
- 第 1 步: 绘制节点 node 的样式
// 节点node绘图函数
export function diagram(ctx: CanvasRenderingContext2D, node: Node) {
  ctx.beginPath();
  // ...
  ctx.fill();
  ctx.stroke();
}

// [可选] 计算节点node图标区域,默认使用矩形相关函数.
export function diagramIconRect(node: Node) {
  let w = node.rect.width / 3;
  let h = node.rect.height / 3;
  if (w > h) {
    w = h;
  } else {
    h = w;
  }
  let top = node.rect.width / 5;
  if (top < 10) {
    top = 10;
  }
  node.iconRect = new Rect(node.rect.x + (node.rect.width - w) / 2, node.rect.y + top, w, h);
}

// [可选] 计算节点node文字区域,默认使用矩形相关函数.
// fullTextRect - Only text.
// iconTextRect - Incloud icon and text.
export function diagramTextRect(node: Node) {
  let bottom = node.rect.height / 10;
  if (bottom < 5) {
    bottom = 0;
  }
  node.iconTextRect = new Rect(
    node.rect.x + node.rect.width / 3,
    node.rect.y + (node.rect.height * 2) / 3 - bottom,
    node.rect.width / 3,
    node.rect.height / 3 - 5
  );

  const w = node.rect.width / 2;
  const h = (node.rect.height * 1) / 2;
  node.fullTextRect = new Rect(node.rect.x + (node.rect.width - w) / 2, node.rect.y + node.rect.height / 4, w, h);
}

// [可选] 计算节点node可连线的锚点,默认使用矩形相关函数.
export function diagramAnchors(node: Node) {
  node.anchors.push(new Point(node.rect.x + node.rect.width / 2, node.rect.y, Direction.Up));
  node.anchors.push(new Point(node.rect.x + node.rect.width, node.rect.y + node.rect.height / 2, Direction.Right));
  node.anchors.push(new Point(node.rect.x + node.rect.width / 2, node.rect.y + node.rect.height, Direction.Bottom));
  node.anchors.push(new Point(node.rect.x, node.rect.y + node.rect.height / 2, Direction.Left));
}
- 第 2 步: 注册节点 node
// registerNode: Register a custom node.
// name - The name of node.
// drawFn - How to draw.
// anchorsFn - How to get the anchors.
// iconRectFn - How to get the icon rect.
// textRectFn - How to get the text rect.
// force - Overwirte the node if exists.
registerNode(
name: string,
drawFn: (ctx: CanvasRenderingContext2D, node: Node) => void,
anchorsFn?: (node: Node) => void,
iconRectFn?: (node: Node) => void,
textRectFn?: (node: Node) => void,
force?: boolean
);
有任何建议或问题可以在 issue 提出;或提供一个 pr。
MIT © le5le.com
