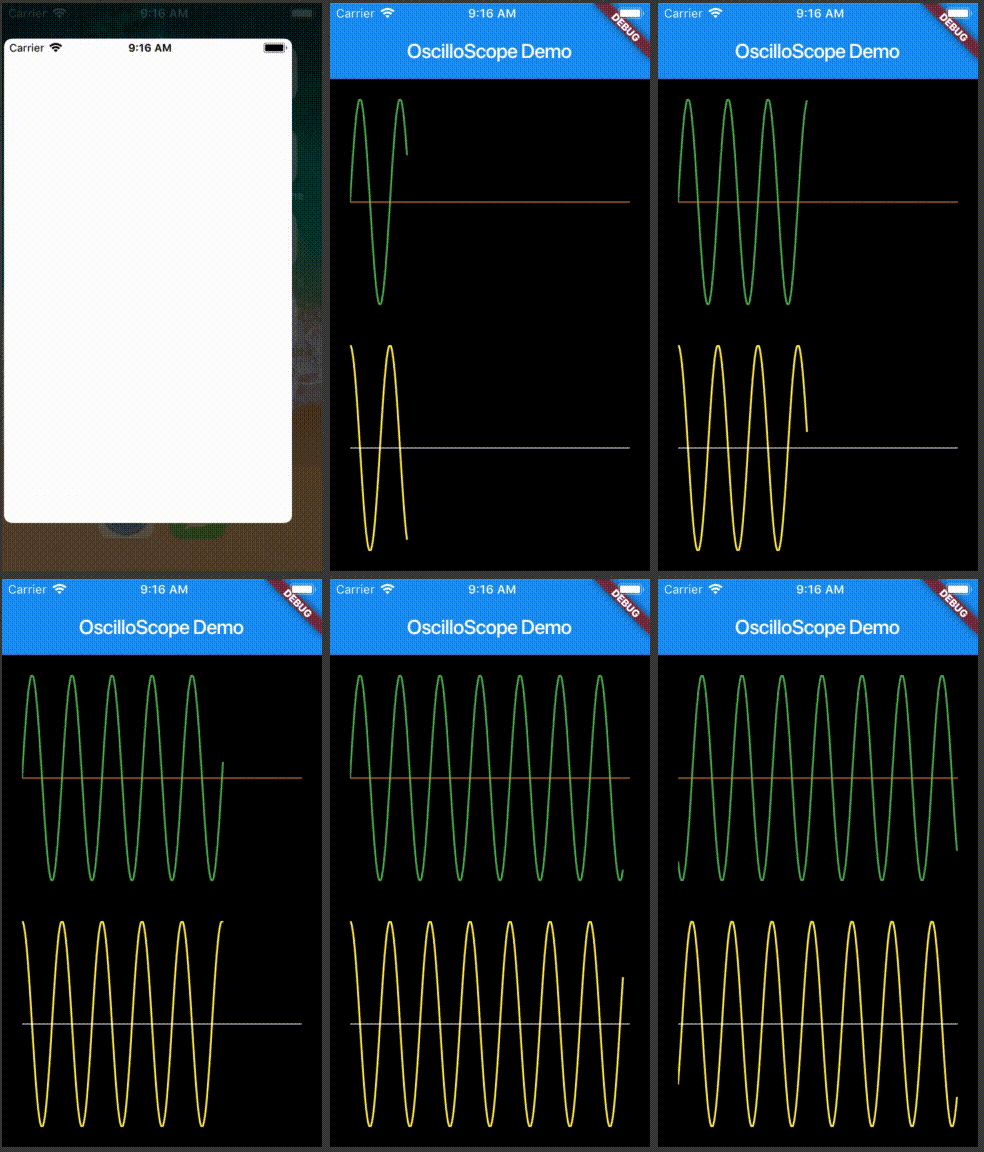
Oscilloscope is a graphical display similar to the trace on an oscilloscope that will display values as it scrolls across the screen. The widget uses a List as the source of the data to display and will scale the information to fit the display. Take a look at the example to see how it can be used.
Each time a value is added to the dataset another point is plotted on the trace, this trace will extends from left to right across the screen until it reaches the end. At this point the trace will then scroll to show new values.
The display can be customised using the following values:
- backgroundColor - the default is Colors.black
- traceColor - the default color is Colors.white
- margin - the default is EdgeInsets.all(10.0)
- strokeWidth - the default width is 2.0
- showYAxis - show or hide a line representing the 0 yAxis (default is false)
- yAxisColor - if the yAxis is set for display it will show in this color (default is Colors.white)
The other settings are
- dataSet - this is the data that is used to generate the trace
- yAxisMin - an indicator to define the minimum value found in the dataSet (default 0.0)
- yAxisMax - an indicator to define the maximum value found in the dataSet (default 1.0)
yAxisMin and yAxisMax are used by the widget to determine the scaling factor so all data values are displayed. These values can be altered to modify the data display scale.
For package install see here.
For help getting started with Flutter, view the online documentation.
