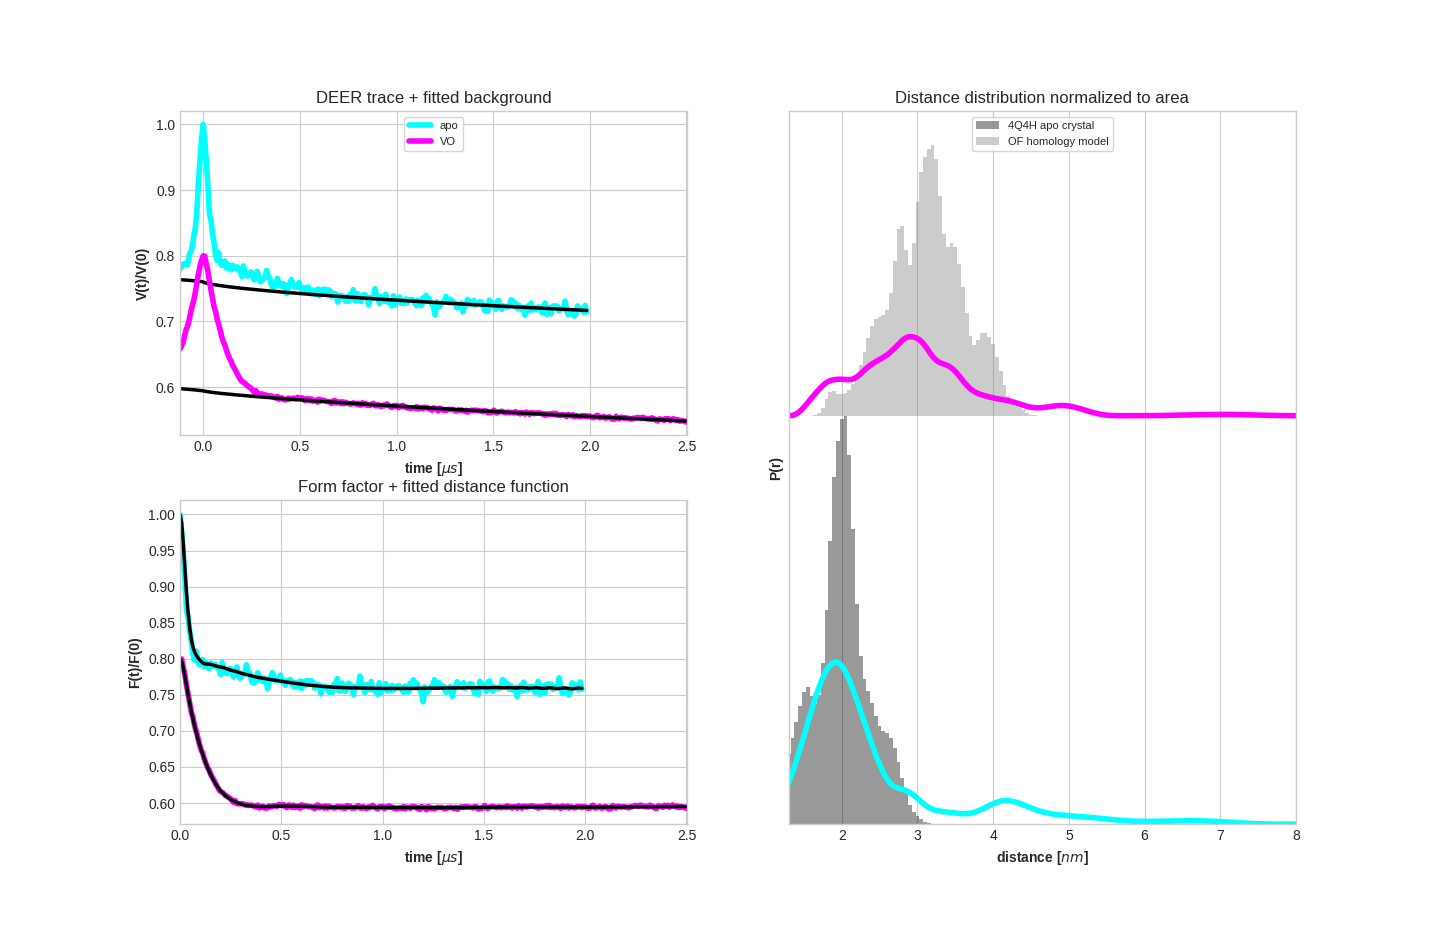
DEERplot plots the output from however many DeerAnalysis files that you created and compare them for you and saves the PDF file. For a complete description and downloading packaged .exe file please refer to my website: spintoolbox.com

If you want to use the UI for selecting the files and ploting them interactively, you can use DEERplot.py. The downside though is that you do not get the python code saved anywhere so that it can be changed later on or new data files can be added to it. For removing this problem I added DEERplot_noGUI.py which is essentially only the plot() function to which the filenames, colors, etc. are passed as arrays. Please make sure that you have dependencies installed on you system
You can do the following when using DEERplot_noGUI.py:
# Enter the folder name for DeerAnalysis files. You can also leave this empty and add folder to file names
deerFolder = ''
# Enter DeerAnalysis files list here
deerFiles = ['apo_d2_2200ns_DEER_bckg.dat','VO_d2_2200ns_DEER_bckg.dat']
# Enter titles if you want. Otherwise the filenames will become titles.
deerTitles = ['apo','VO']
# And colors if you want
deerColors = ['cyan','magenta']
# Also background colors. Default value is always black unless you have black for main color. Then this will be gray.
backgroundColors = ['black','black']
# Offset for time trace and form factor. I make offset for all data to be seen without overlaps.
offsetArr = [0, .2]
# Set the linewidth for your plots. Default values are 4 for mLineWidth(main line) and 2.5 for oLineWidth (background line).
mLineWidthArr = []
oLineWidthArr = []
# upper panel or lower panel in distance dist. (only used when using plotType='3plotsWoffset')
deerDistOffset = [0, 1]
# Enter the folder name for simulation files. You can also leave this empty and add folder to file names
simFolder = ''
# Simulations file names
simFiles = ['[4Q4H](A){1}271_[4Q4H](A){1}54_distr.dat']
# Titles for simulation
simTitles = ['4Q4H apo crystal']
# Simulations colors
simColors = ['black']
# upper panel or lower panel in distance dist. (only used when using plotType='3plotsWoffset')
simDistOffset = [0]
# x-range for time trace, fit and distance distribution plots. You can also leave this empty
timeTraceXlim = []
fitXlim = []
distanceXlim = [1,8]
# Title to be shown on top of plots.
suptitle = "TM287/288 WT"
# Set the folder for saving plots. By default this will use current folder.
plotFolder = os.path.realpath(__file__)
# Remove some from fit (only fitted function is removed) plot and distance plot (for when you do not have a signal but want to show the primary)
rmFitDistr = []
# Plot file extensions.
plotExts = ['png','pdf','eps','jpg']
# If you want your plot files to have date on them, make this True.
dateInPlot = False
# If you want the function to show you the plot at the end, make this True.
showPlot = True
# Finally, we call the function to plot
plot(
    deerFolder = deerFolder,
    filesArr = deerFiles,
    titlesArr = deerTitles,
    deerColors = deerColors,
    backgroundColors = [],
    offsetArr = offsetArr,
    mLineWidthArr = [],
    oLineWidthArr = [],
    deerDistOffset = deerDistOffset,
    simFolder = simFolder,
    simFiles = simFiles,
    simTitles = simTitles,
    simColors = simColors,
    plotType='3plotsWoffset', #'4plots','3plots' and '3plotsWoffset'
    simDistOffset = simDistOffset,
    distanceXlim = distanceXlim,
    timeTraceXlim = timeTraceXlim,
    fitXlim = fitXlim,
    suptitle = suptitle,
    plotFolder = plotFolder,
    rmFitDistr = rmFitDistr,
    plotExts = plotExts,
    dateInPlot = dateInPlot,
    showPlot = showPlot,
)
If you do not want to copy DEERplot_noGUI.py to every folder you can put it somewhere and do the following on top of your python file:
import sys
sys.path.insert(0, '/mnt/RUBfileShare/Codes/Python/DEERplot/')
from DEERplot_noGUI import *