Gregory Way 2019
In this module, we use the compressed latent features from 5 algorithms and across 28 different dimensions, to predict cancer type and gene alteration status in The Cancer Genome Atlas (TCGA) gene expression data.
We predict cancer types and gene alterations using a logistic regression algorithm penalized with elastic net. We previously used a similar approach to predict Ras pathway activation in the same data set (Way et al. 2018). Rather than using raw gene expression features, we predict cancer types and mutations using compressed gene expression features.
Our goal in this analysis was to determine the ability of the constructed features to learn signals representing cancer type and gene alterations. Our aim was to observe at which dimension and at what strength the signals appeared in the compression models. Furthermore, the compression algorithms aggregate groups of genes together that represent coordinated biological processes. Observing how these compressed features participated in the models (by model coefficients) we can make statements about the compressed features biologically.
Notes
- Samples with a hypermutater phenotype were removed from the data set (greater than 5 standard deviations over the mean of log10 mutation rate)
- All models are adjusted for log10 mutation rate
- Gene alteration predictions only:
- These models are also adjusted by cancer type
- To regulate balanced class sizes, only cancer types with greater than 15% of either positive or negative gene alteration class (and more than 5 samples in) were used to train models
- Gene alteration was defined as any non-silent mutation in the gene of interest, or a copy number amplification for an oncogene, or copy number deletion for a tumor suppressor gene.
TCGA has profiled 33 different cancer-types. We constructed supervised machine learning tasks to distinguish each cancer-type from all others.
We selected the top 50 most mutated genes in TCGA to predict. Using non silent mutation and copy number status, we predicted the alteration status of these genes in the included cancer types.
We also track performance of the supervised learning algorithm using features derived from three different kinds of ensemble models.
- 5 iterations of VAE fitting for each latent dimension (VAE Ensemble)
- 1 iteration of 5 algorithms (PCA, ICA, NMF, DAE, VAE) for each latent dimension (Model Ensemble)
- All BioBombe compressed features in a single model (All Ensemble) (30,850 features)
All of our results are deposited in a publicly available resource.
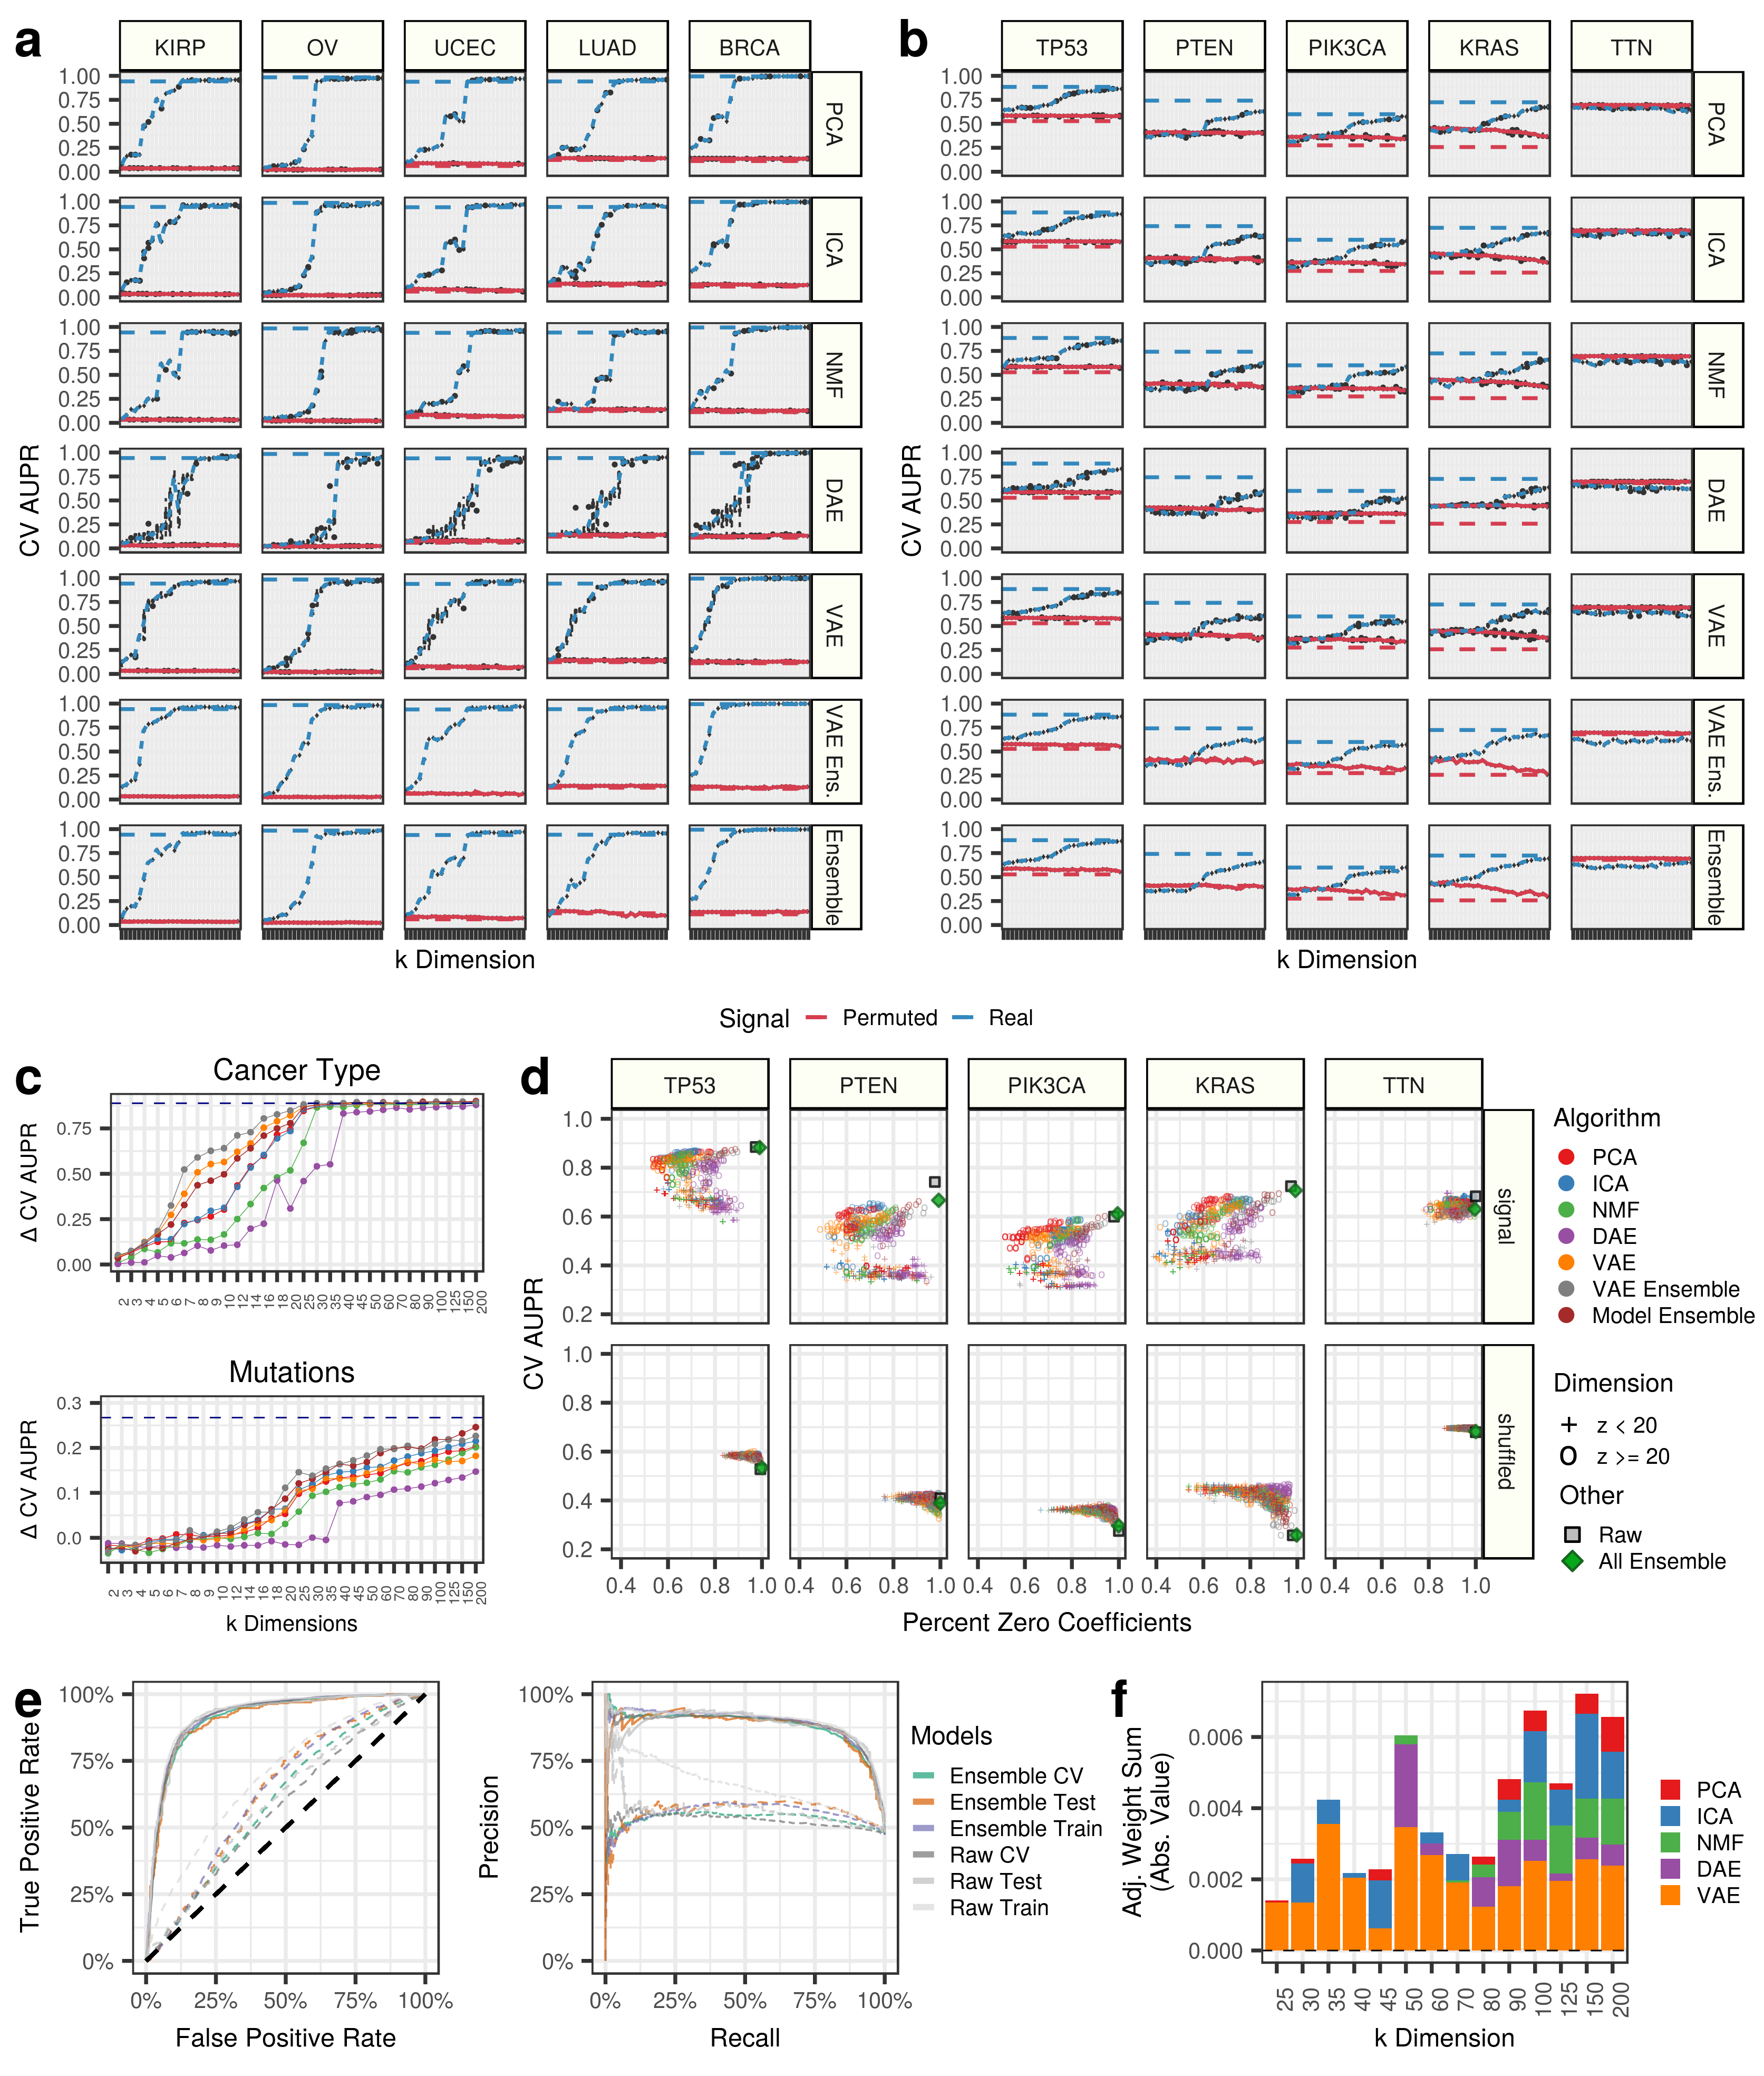
We highlight predictions in 5 select cancer types and 5 important cancer genes. Panel A describes performance for predicting cancer types, while Panel B displays gene alteration prediction performance. For both panels, the red line represents permuted data input into the compression algorithms, and blue lines are real data. The red and blue dotted lines represents prediction performance with raw gene expression data, and the grey dotted line represents a hypothetical guess. Note that the permuted models include covariate information.
It appears that all of these cancer types can be predicted with 100% accuracy with raw gene expression features and at early to intermediate compression dimensions. However, the gene alteration status are predicted with modest accuracy, and signal only starts to emerge at intermediate to late compression dimensions (Panel C Above). This indicates that cancer-type signatures are features learned at early dimensions and are some of the highest sources of variation in this dataset, while mutation signatures are learned in higher dimensions.
We also track the sparsity, as the percentage of the model coefficients that are zero, for real and compressed predictions of gene alteration status (Panel D Above). The grey square represents the models with raw gene expression. In all cases, it appears that the models with low dimension are not performing as well as the models with high dimensions. It also appears that denoising autoencoders (DAE) are the sparsest models.
We specifically tracked the performance of the all feature ensemble model to predict TP53 inactivation. The all feature ensemble model included 30,850 compression features and had 98.97% of the features with zero coefficients (30,533 out of 30,850). Therefore 317 coefficients were non zero.
We applied the network projection interpretation approach to these coefficients used in predicting TP53 alterations.
The top ranked GpH gene sets for these features included:
| big_feature_id | abs_z_score | individual_feature | k | signal | weight | abs | gene | variable | value | z_score |
|---|---|---|---|---|---|---|---|---|---|---|
| vae_133_978124_200_signal | 10.5085 | 133 | 200 | signal | 0.082262 | 0.082262 | TP53 | HALLMARK_ESTROGEN_RESPONSE_EARLY | -3.89942 | -10.5085 |
| vae_133_978124_200_signal | 6.83035 | 133 | 200 | signal | 0.082262 | 0.082262 | TP53 | HALLMARK_ESTROGEN_RESPONSE_LATE | -4.346 | -6.83035 |
| vae_133_978124_200_signal | 6.42001 | 133 | 200 | signal | 0.082262 | 0.082262 | TP53 | HALLMARK_P53_PATHWAY | -3.46517 | -6.42001 |
| vae_133_978124_200_signal | 6.38283 | 133 | 200 | signal | 0.082262 | 0.082262 | TP53 | HALLMARK_COAGULATION | -2.60747 | -6.38283 |
| vae_133_978124_200_signal | 6.15825 | 133 | 200 | signal | 0.082262 | 0.082262 | TP53 | HALLMARK_XENOBIOTIC_METABOLISM | -3.64404 | -6.15825 |
| vae_6_908341_50_signal | 13.4192 | 6 | 50 | signal | 0.075826 | 0.075826 | TP53 | HALLMARK_TNFA_SIGNALING_VIA_NFKB | -4.42049 | -13.4192 |
| vae_6_908341_50_signal | 10.688 | 6 | 50 | signal | 0.075826 | 0.075826 | TP53 | HALLMARK_XENOBIOTIC_METABOLISM | -5.68437 | -10.688 |
| vae_6_908341_50_signal | 7.52623 | 6 | 50 | signal | 0.075826 | 0.075826 | TP53 | HALLMARK_COAGULATION | -4.08482 | -7.52623 |
| vae_6_908341_50_signal | 7.41978 | 6 | 50 | signal | 0.075826 | 0.075826 | TP53 | HALLMARK_MYC_TARGETS_V1 | 0.408717 | 7.41978 |
| vae_6_908341_50_signal | 6.68337 | 6 | 50 | signal | 0.075826 | 0.075826 | TP53 | HALLMARK_KRAS_SIGNALING_UP | -4.51147 | -6.68337 |
| vae_4_908341_150_signal | 8.68153 | 4 | 150 | signal | -0.065103 | 0.065103 | TP53 | HALLMARK_BILE_ACID_METABOLISM | 0.0707084 | 8.68153 |
| vae_4_908341_150_signal | 7.60301 | 4 | 150 | signal | -0.065103 | 0.065103 | TP53 | HALLMARK_EPITHELIAL_MESENCHYMAL_TRANSITION | -4.43528 | -7.60301 |
| vae_4_908341_150_signal | 6.80611 | 4 | 150 | signal | -0.065103 | 0.065103 | TP53 | HALLMARK_FATTY_ACID_METABOLISM | -0.831578 | 6.80611 |
| vae_4_908341_150_signal | 5.90416 | 4 | 150 | signal | -0.065103 | 0.065103 | TP53 | HALLMARK_OXIDATIVE_PHOSPHORYLATION | -0.54764 | 5.90416 |
| vae_4_908341_150_signal | 5.87387 | 4 | 150 | signal | -0.065103 | 0.065103 | TP53 | HALLMARK_ESTROGEN_RESPONSE_EARLY | -0.789038 | 5.87387 |
| dae_140_451283_150_signal | 8.40018 | 140 | 150 | signal | -0.062348 | 0.062348 | TP53 | HALLMARK_INTERFERON_ALPHA_RESPONSE | -3.10989 | -8.40018 |
| dae_140_451283_150_signal | 3.81763 | 140 | 150 | signal | -0.062348 | 0.062348 | TP53 | HALLMARK_INTERFERON_GAMMA_RESPONSE | -2.36052 | -3.81763 |
| dae_140_451283_150_signal | 3.6102 | 140 | 150 | signal | -0.062348 | 0.062348 | TP53 | HALLMARK_CHOLESTEROL_HOMEOSTASIS | 1.30372 | 3.6102 |
| dae_140_451283_150_signal | 3.43927 | 140 | 150 | signal | -0.062348 | 0.062348 | TP53 | HALLMARK_REACTIVE_OXIGEN_SPECIES_PATHWAY | -0.811733 | -3.43927 |
| dae_140_451283_150_signal | 3.09878 | 140 | 150 | signal | -0.062348 | 0.062348 | TP53 | HALLMARK_ESTROGEN_RESPONSE_LATE | 1.6836 | 3.09878 |
| nmf_97_486191_200_signal | 16.9001 | 97 | 200 | signal | -0.061847 | 0.061847 | TP53 | HALLMARK_E2F_TARGETS | 31.2308 | 16.9001 |
| nmf_97_486191_200_signal | 12.4126 | 97 | 200 | signal | -0.061847 | 0.061847 | TP53 | HALLMARK_G2M_CHECKPOINT | 22.7514 | 12.4126 |
| nmf_97_486191_200_signal | 10.763 | 97 | 200 | signal | -0.061847 | 0.061847 | TP53 | HALLMARK_DNA_REPAIR | 11.8644 | 10.763 |
| nmf_97_486191_200_signal | 9.65131 | 97 | 200 | signal | -0.061847 | 0.061847 | TP53 | HALLMARK_MYC_TARGETS_V1 | 18.653 | 9.65131 |
| nmf_97_486191_200_signal | 6.02457 | 97 | 200 | signal | -0.061847 | 0.061847 | TP53 | HALLMARK_MITOTIC_SPINDLE | 8.9368 | 6.02457 |
These genesets represent a sample of the highest scoring hallmark processes activated and deactivated in samples with TP53 activation.
Receiver operating characteristic (ROC) curves and precision recall curves (Panel E Above) are presented for training, testing, and cross validation (CV) data partitions for predictions using raw gene expression features and compressed gene expression features.
We also tracked which features were being used by the logistic regression model across algorithms and latent dimensions. VAEs were generally useful throughout k dimension, but the classifier used signal that was generated across algorithms and latent dimensions (Panel F Above)
We were also interested in observing performance using hand picked features.
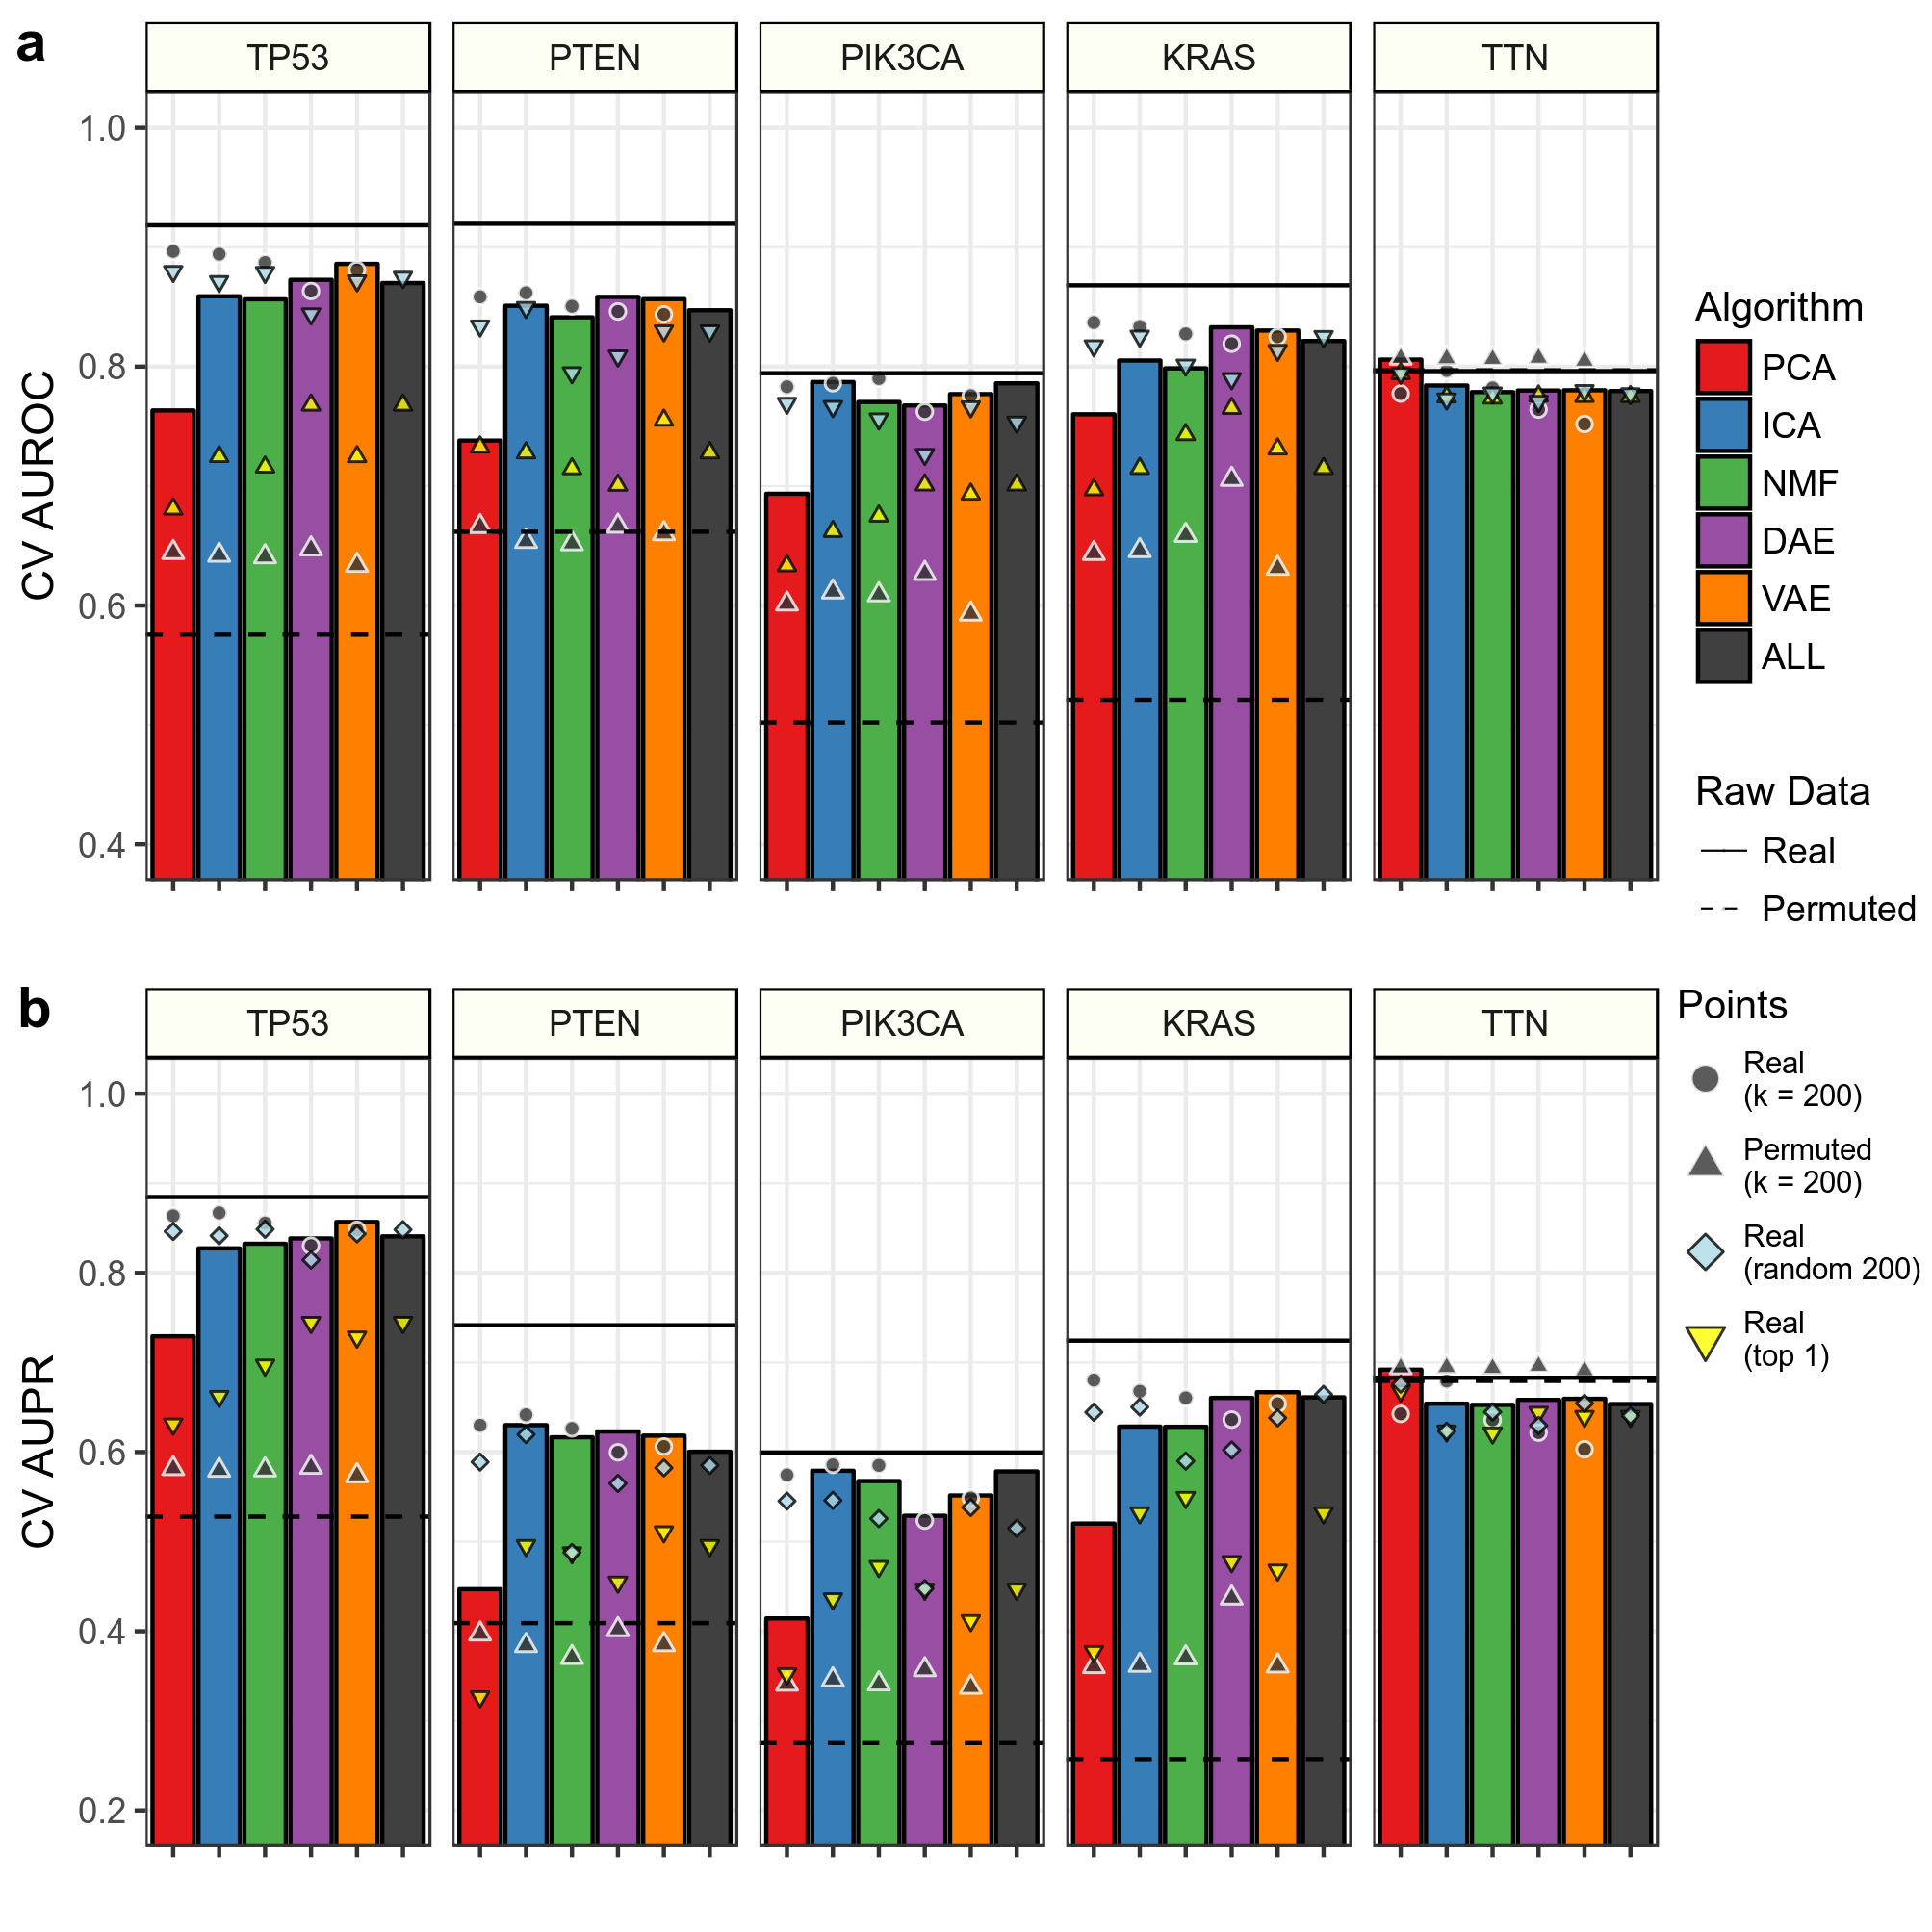
We compared AUROC (Panel A Above) and AUPR (Panel B Above) in cross validation (CV) training folds for predictions using k = 200 features to 200 of the top scoring features across all tested k dimensions. The height of the bar represents performance in these top 200 features. We also compared predictions using the top 1 feature and 200 randomly selected features. Also shown are predictions using raw RNAseq data.
We determined top features based on coefficient weights in their respective prediction tasks. Our hypothesis was that different compression algorithms would aggregate together various signals applicable to the gene alteration prediction task.
Overall, it does not appear that aggregating top features improves performance, especially in linear models. Also, aggregating features together removes some prediction signal, as the raw data predictions have higher performance than all predictions with compressed features.
To reproduce the results of the TCGA classification analysis perform the following:
# Activate computational environment
conda activate biobombe

# Perform the analysis
cd 9.tcga-classify
./classify_analysis.sh