Gregory Way 2019
In this module, we assess the "coverage" of specific gene set collections across data sets and k dimensions.
- Apply BioBombe network projection approach for a given gene set collection and data set.
- The network projection is applied to all compression models and k dimensions.
- Select the top scoring gene set for a single compression feature by BioBombe z score - assign the feature to this gene set.
- Determine p value from the z score and remove the feature if the p value is greater than a Bonfferoni adjusted value (adjusted by number of model dimensions).
- Aggregate all features in individual models and divide the number of unique gene sets by the total number of gene sets.
In addition, we also track the ensemble and all model gene set coverage.
We also determine coverage after analyzing all features for all algorithms, iterations, and k dimensions.
We call this value the BioBombe Coverage
The ensemble coverage aggregates the gene sets identified in the top features of all five iterations of the same algorithm and k dimension.
The all model coverage aggregates the gene sets identified in the top features in all iterations across all models for each k dimension independently.
We calculated coverage for the following combinations:
| Dataset | Collection |
|---|---|
| TCGA | GpH |
| TCGA | GpXCELL |
| TCGA | GpC4CM |
| TCGA | GpC2CPREACTOME |
| TCGA | GpC3TFT |
| TARGET | GpH |
| TARGET | GpXCELL |
| TARGET | GpC4CM |
| GTEX | GpXCELL |
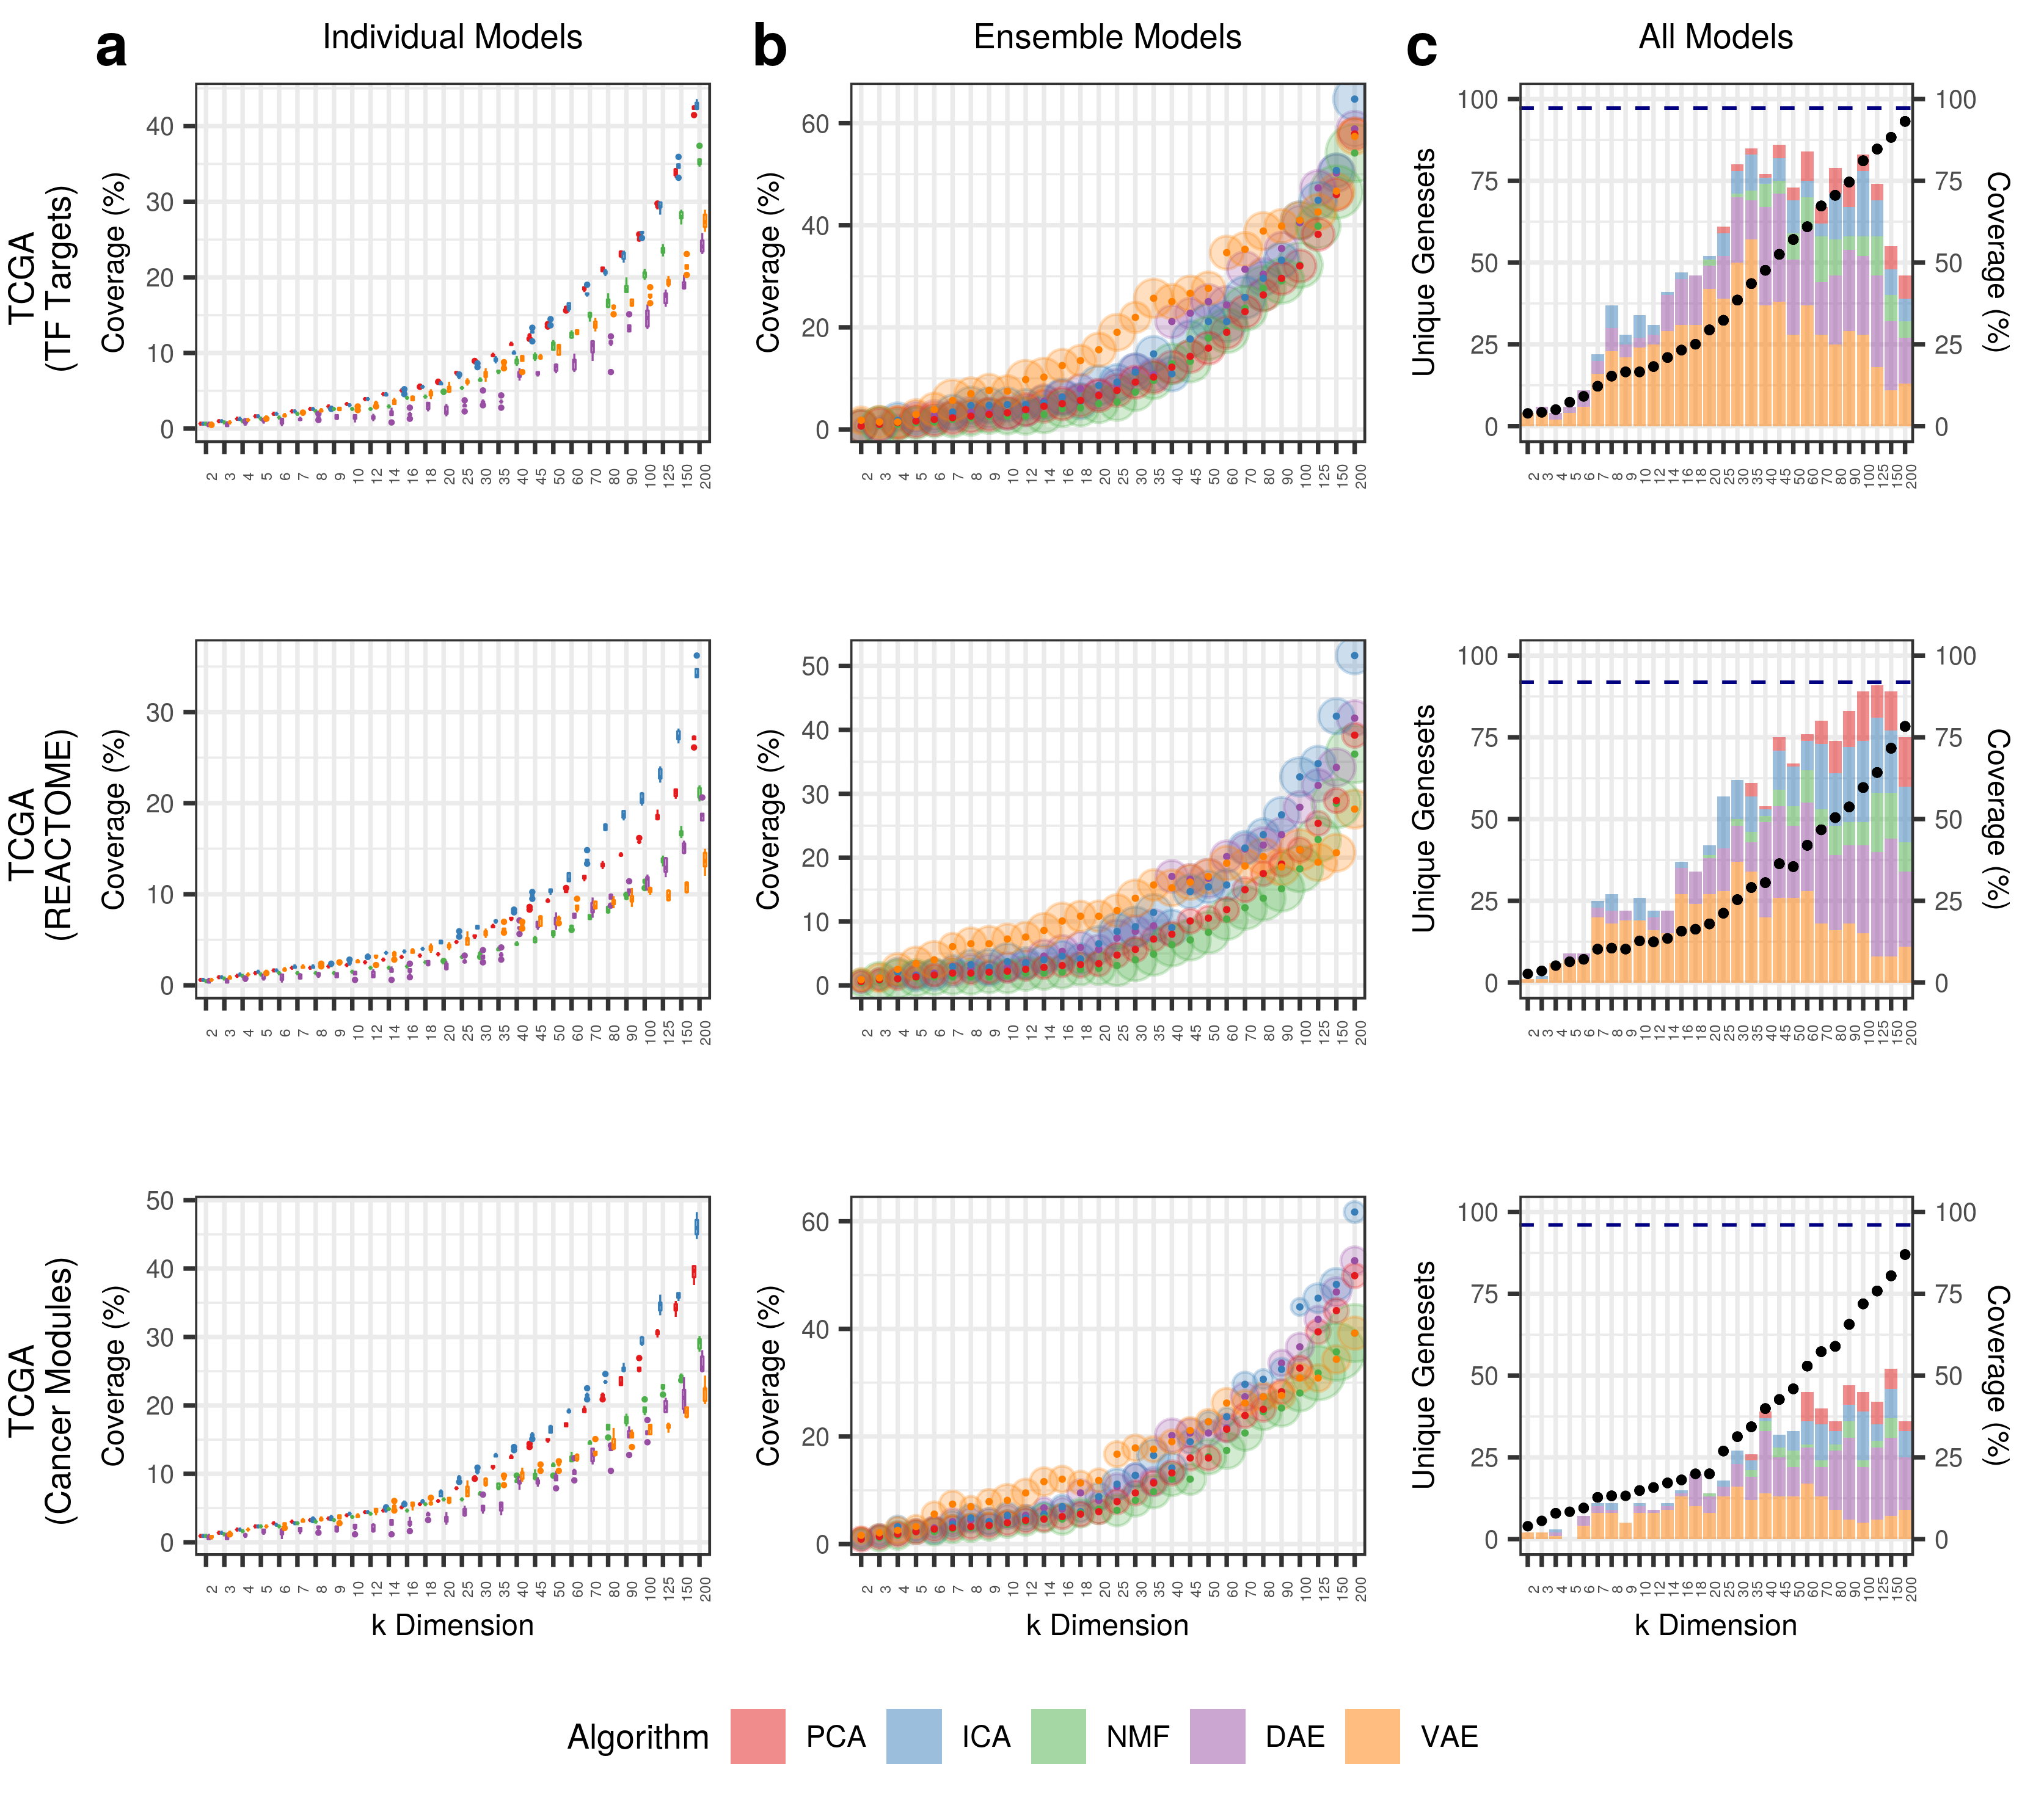
The left panels show coverage for individual models, the middle panels show coverage for ensemble models, and the right panels show coverage for all models.
All plots show coverage across different k dimensions for the dataset and gene set collection shown on the y axis label.
The size of the transparent circles in the ensemble model plot (middle) describe the average absolute value z score, with larger points identifying
gene sets with greater enrichment.
The all model plots (right) show the total coverage percentage on the alternate y axis (black dots).
In the all model plots we also show the algorithm contributions to the coverage, where the height of the bar represents the number of unique gene sets contributed to by the specific algorithm.
Additionally, the dotted navy line represents the BioBombe Coverage for the specific data set and collection.
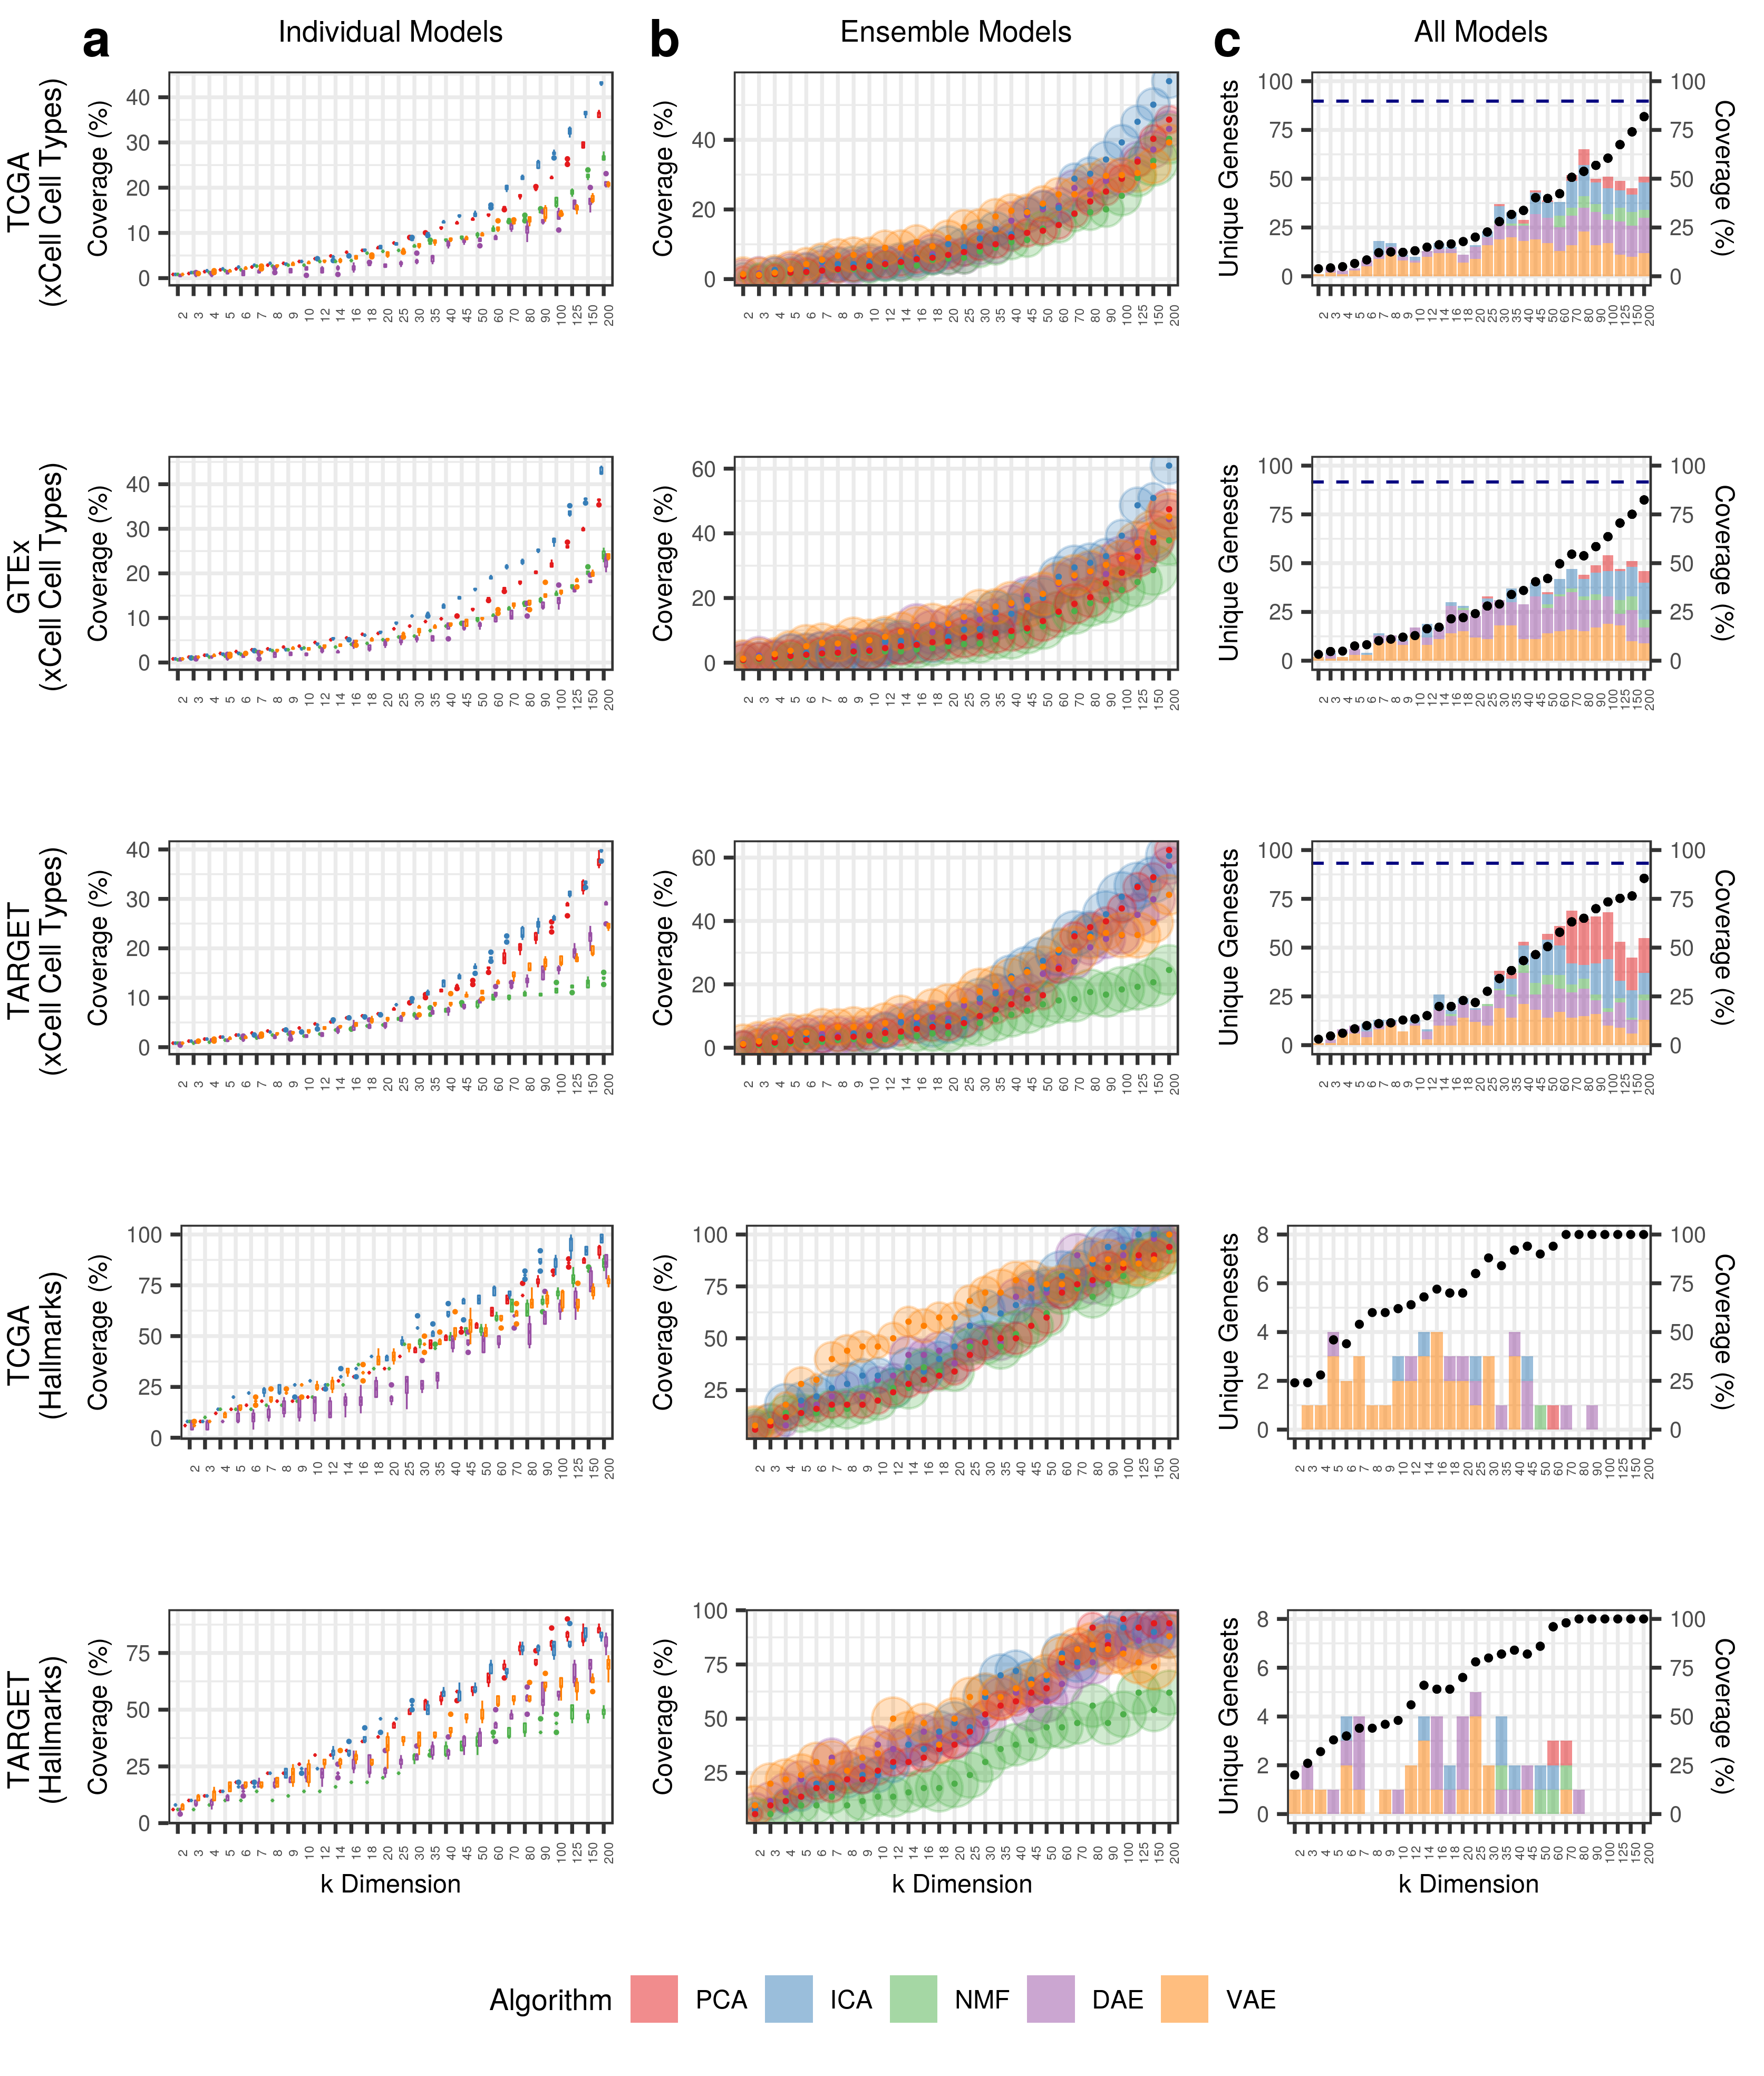
The description above applies for this figure as well.
| Dataset | Metaedge | BioBombe_Coverage |
|---|---|---|
| TCGA | GpH | 100 |
| TCGA | GpXCELL | 89.7750511247444 |
| TCGA | GpC4CM | 96.0556844547564 |
| TCGA | GpC2CPREACTOME | 91.839762611276 |
| TCGA | GpC3TFT | 97.2357723577236 |
| TARGET | GpH | 100 |
| TARGET | GpXCELL | 93.2515337423313 |
| TARGET | GpC4CM | 90.7192575406033 |
| GTEX | GpXCELL | 91.6155419222904 |
Using all derived features, we capture nearly 100% of gene sets in compressed features.
To reproduce the results of the coverage analysis perform the following:
# Activate computational environment
conda activate biobombe

# Perform the analysis
cd 7.analyze-coverage
./run_coverage_analysis.sh