Gregory Way 2018
Samples within each dataset are compressed with dimensionality reduction algorithms. When these samples pass through the bottleneck, they are variably activated by each latent space feature. The activations can represent biological or technical patterns present in a specific quantity for the given sample and feature.
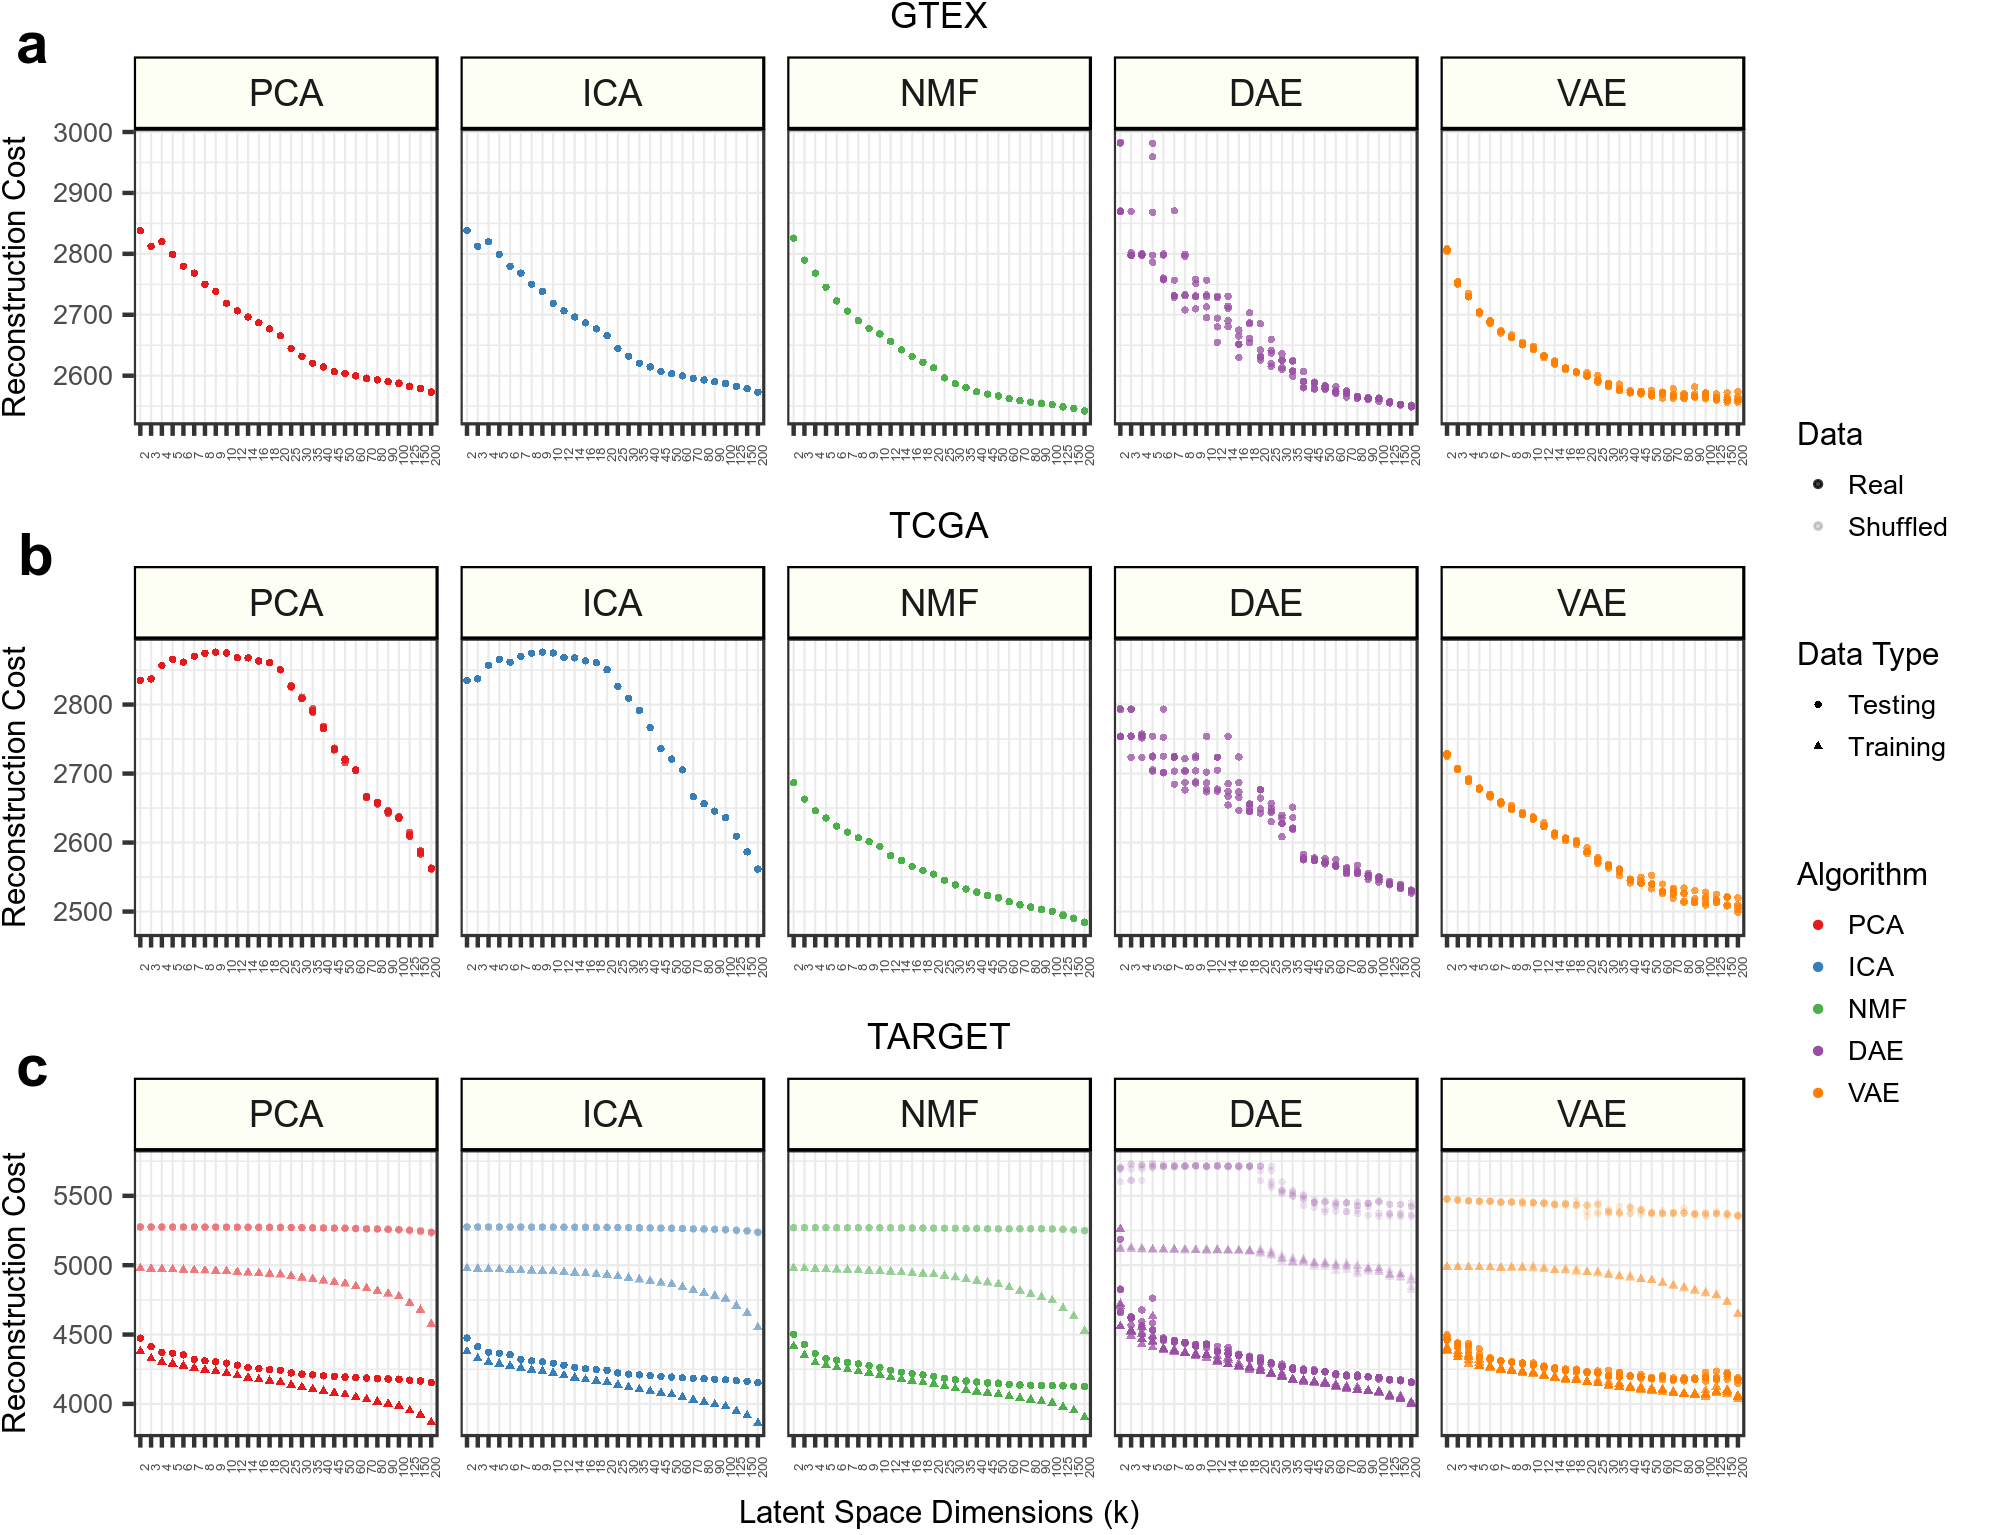
The samples are also reconstructed back into the original input gene expression dimensions. In this module, we explore the ability of compression models to reconstruct and capture signals present in input samples.
The following results were obtained by running the following
conda activate biobombe

# Navigate into this module folder
cd 4.analyze-components
./analysis.shWe compute the reconstruction cost using binary cross entropy between input and reconstructed output. The analysis is provided in 1.visualize-reconstruction.ipynb.
The results are stored in the results folder and the figures are stored in dataset specific folders in figures.
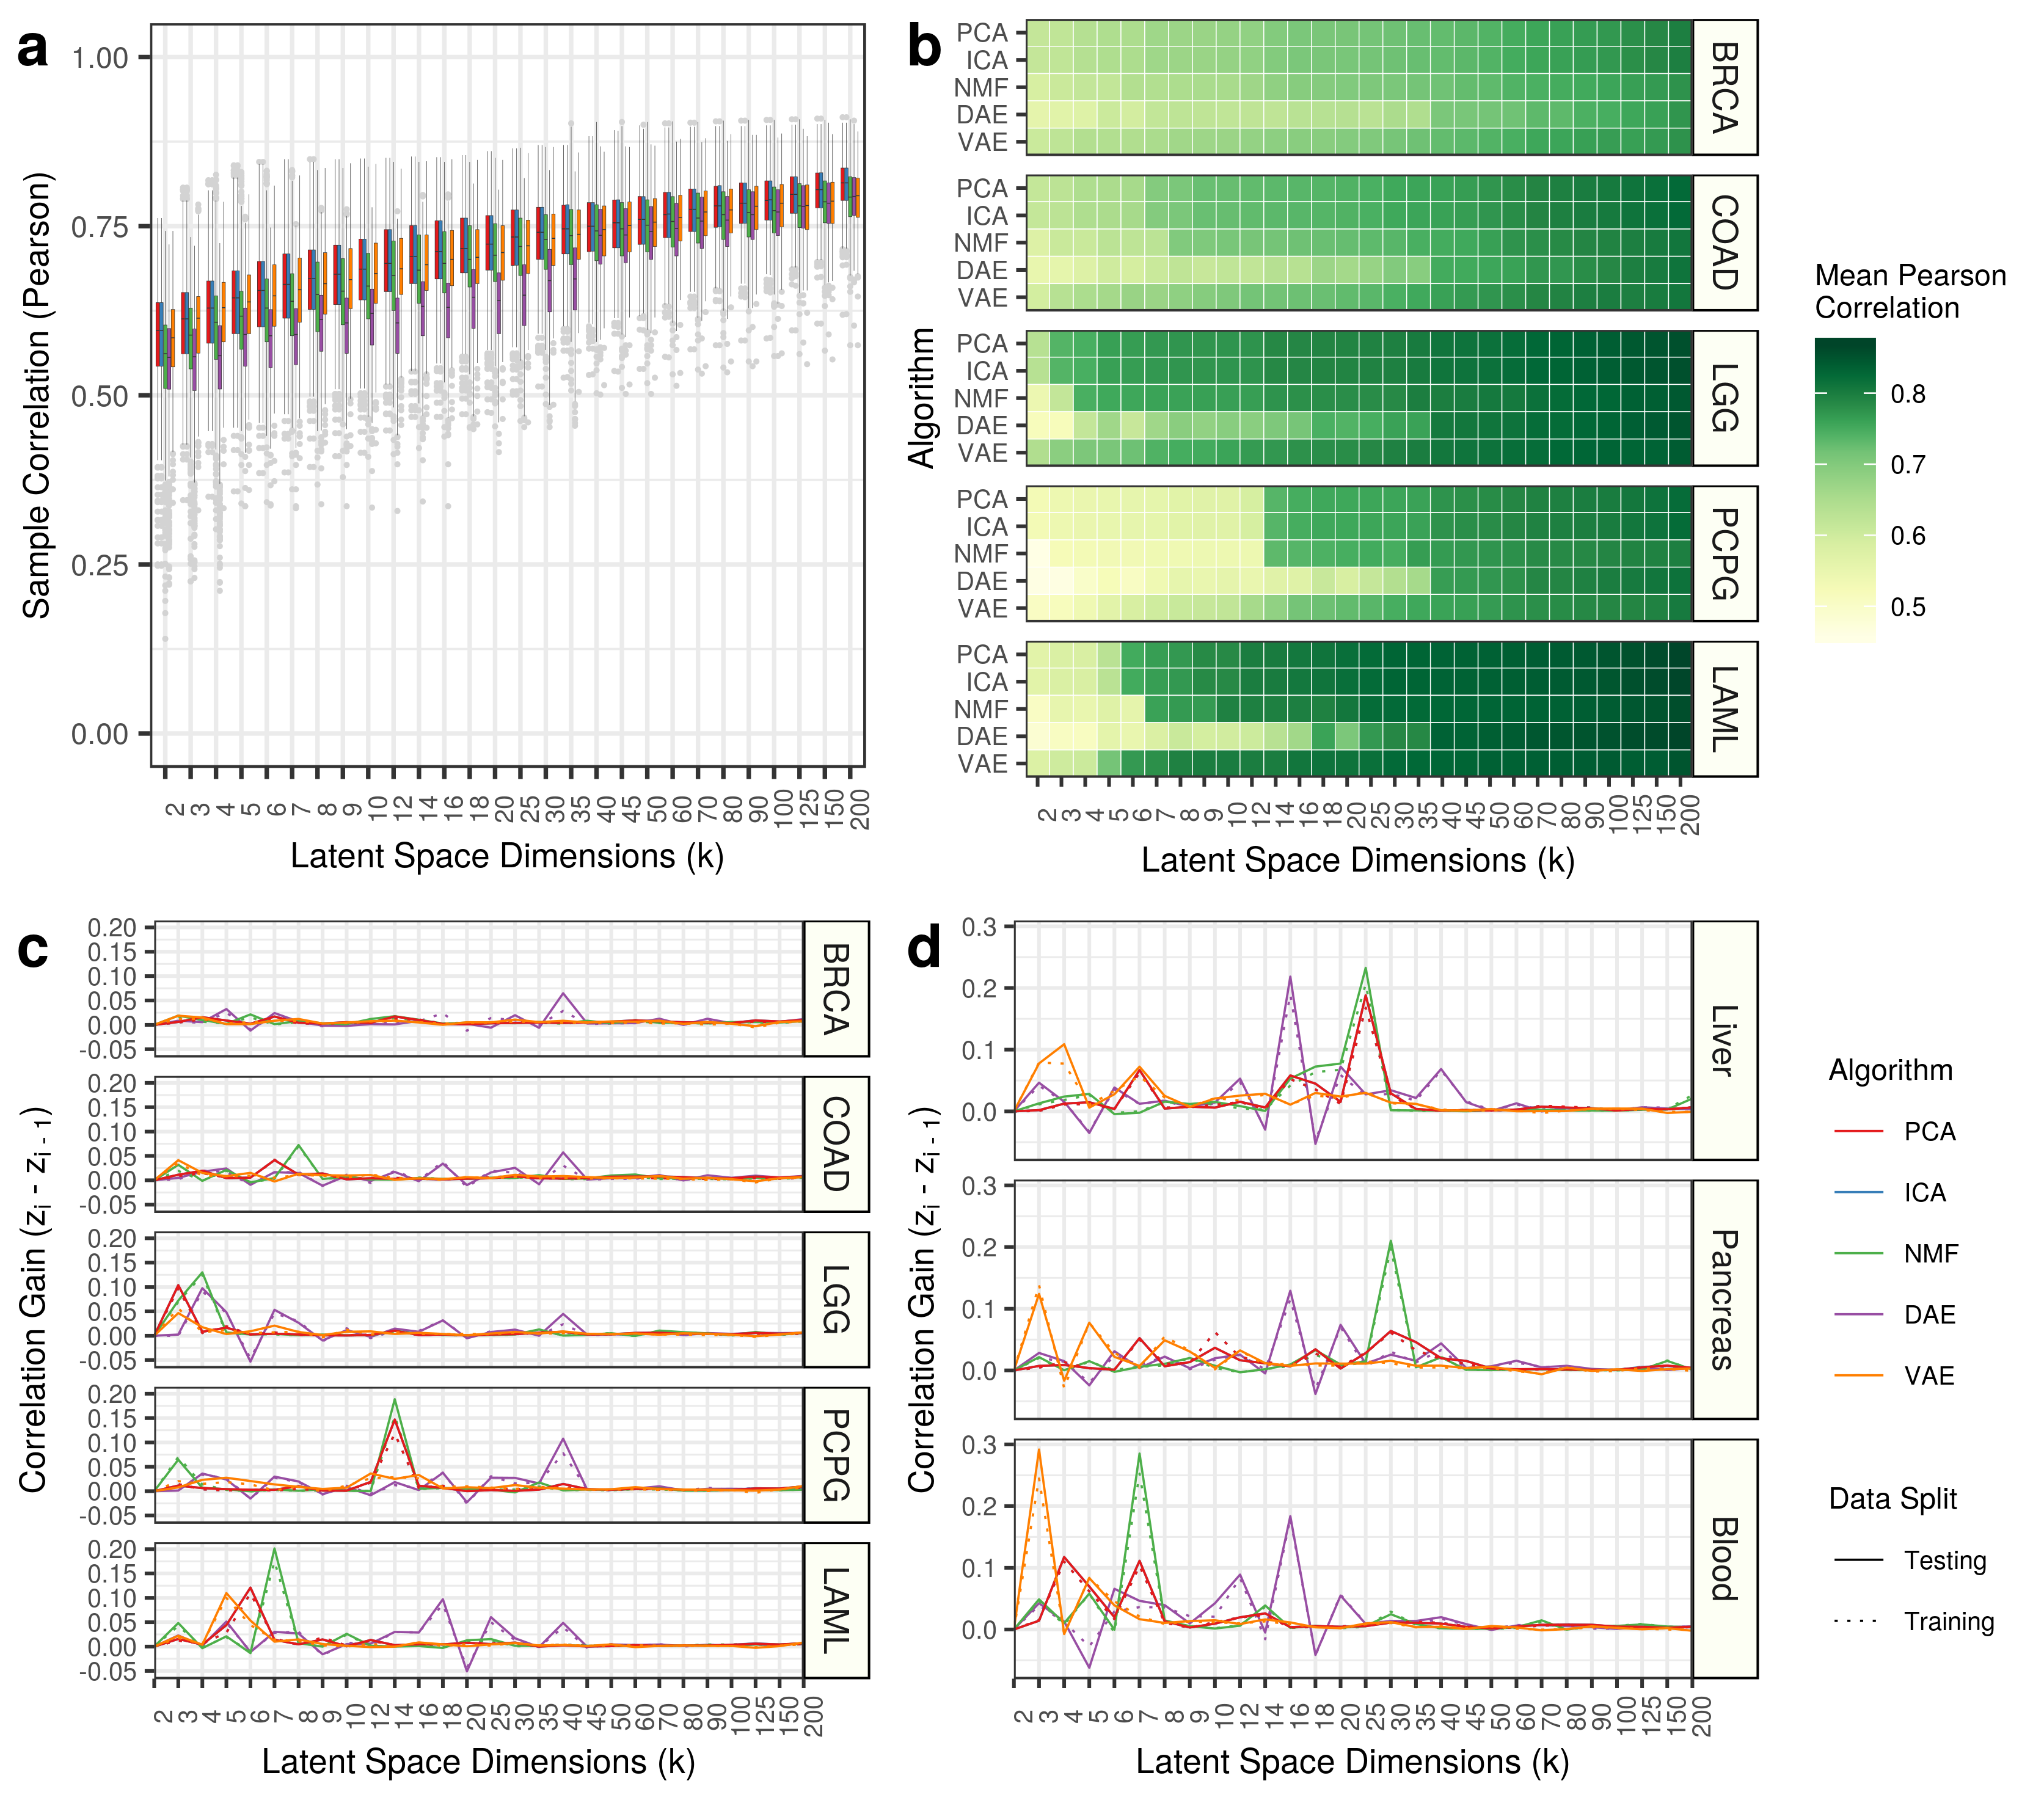
We also track the Pearson and Spearman correlations of input samples to reconstructed output samples. This analysis is provided in 2.visualize-sample-correlation.ipynb.
The results are stored as gzipped files in the results folder and the figures are stored in dataset specific folders in figures.

