-
Notifications
You must be signed in to change notification settings - Fork 0
Analysis
<A plugin framework has been developed to be able to add new analysis to CellMaps. Analysis are mainly developed by us, but third-party developers are invited to add more plugins. Plugins have been organized into four categories:>
CellMaps offers you the possibility of performing some additional analysis to gain insight and characterize your network. Analysis are mainly developed by us, but third-party developers are invited to add more plugins. In the near future we plan to develop a plugin framework so that other researchers can add new analysis to CellMaps.

Plugins have been organized into three categories:
-
Find interactions: This is the basic network functionality. It takes a list of proteins and tries to connect them through the interactome. It finds all the first-degree node neighbors and then extract the corresponding subgraph and all edges that join the proteins in the subgraph.
-
Network Analysis: these options enable the analysis network characteristics as topological parameters and to calculate the modular structure of the network using several algorithm.
- Communities detection analysis This option searches for groups of nodes densely interconnected between them but sparsely connected to the rest of the nodes to identify the community structure of the network. Specifically, the tool links you with the most used three community detection algorithms implemented in the igraph package: fastgreedy, randomwalk and infomap .
- Topological study This option calculates basic network topological parameters such as the connection degree, betweenness centrality and clustering coefficient. These parameters are informative of the possible role of the node within the network.
-
Functional Analysis: these options allow the analysis of cell functionalities represented in the network using Gene Ontology and other databases, as human gene-disease databases, as a reference.
- Network enrichment analysis Evaluates the cooperative behaviour of the list as a subnetwork module.
- Network set enrichment analysis Finds significant subnetworks of protein-protein interactions within a list of ranked genes/proteins
- GO enrichment analysis: Provides significant over-representation of functional annotations by single enrichment analysis
###Communities detection analysis
Biological networks have observed to be highly hierarchical modular. Molecules are usually arranged forming neighbourhoods of highly interconnected nodes. Such sets of molecules define operational entities, identifiable by network clustering algorithms, to which different elementary functions can be attributed. This tool searches for these groups of nodes densely interconnected between them but sparsely connected to the rest of the nodes to identify the community structure of the network.
Specifically, the tool allows you to choose between three community detection algorithms implemented in the R igraph package: fastgreedy, randomwalk and infomap. The following table describes and compares them.
| Algorithm | Basis | Deals with directed networks |
|---|---|---|
| Fastgreedy | This function tries to find dense communities in graphs via directly optimizing a modularity score. | NO |
| Randomwalk | This function tries to find densely connected communities via random walks. The idea is that short random walks tend to stay in the same community. | NO |
| Infomap | Find community structure that minimizes the expected description length of a random walker trajectory | YES |
For a deeper documentation, visit the [R igraph] (http://igraph.org/r/) web page.
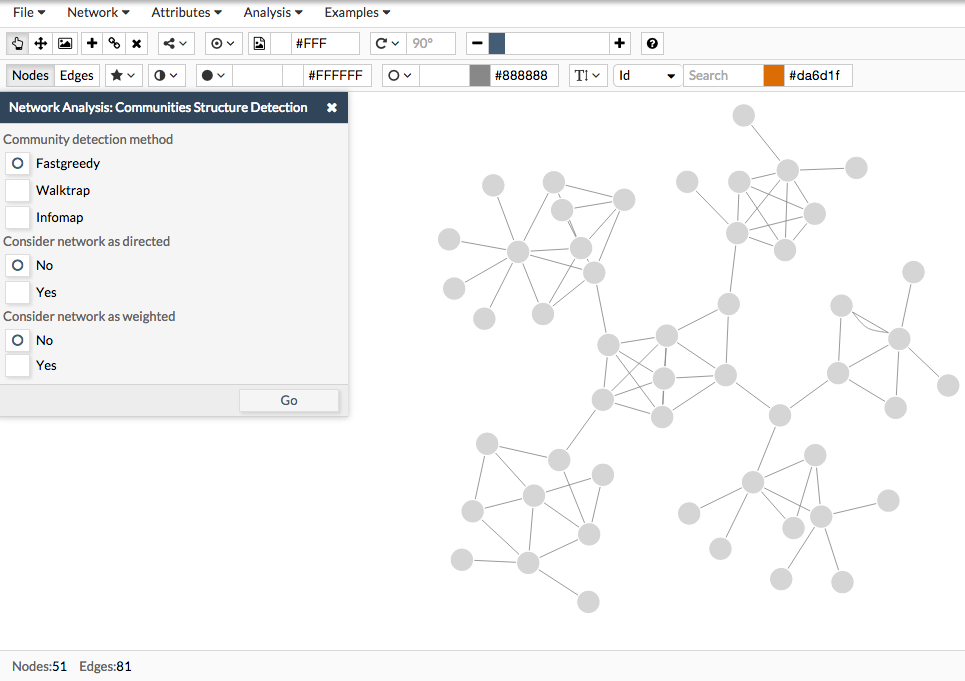
Open the tool by going to Analysis > Community detection. Select the algorithm you want to apply, indicate whether your network is directed or not (only used in Infomap algorithm) and/or weighted.

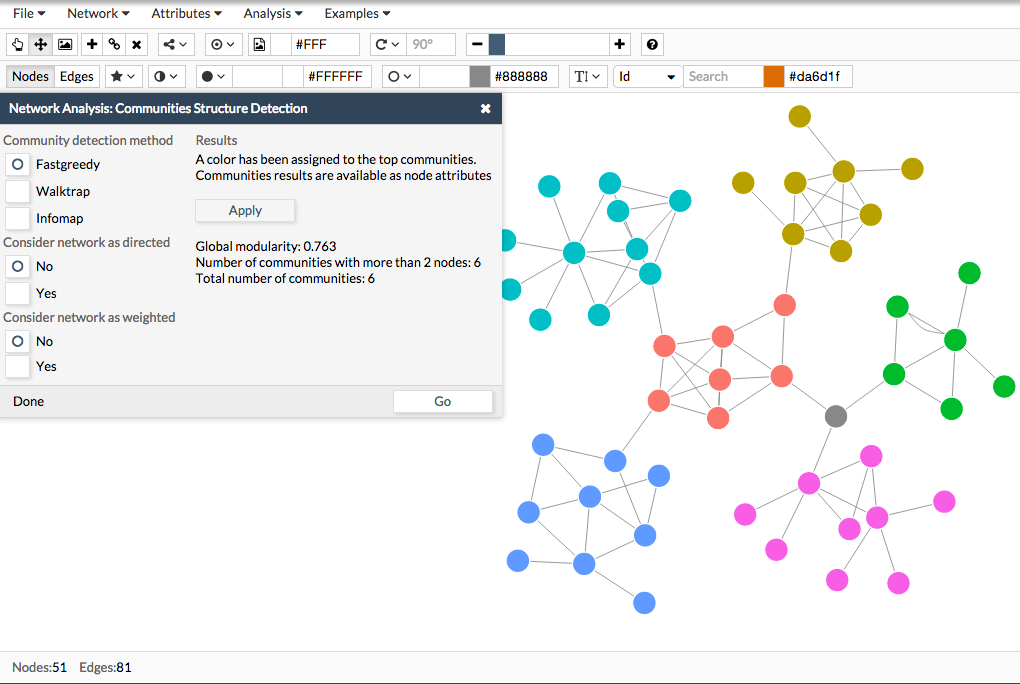
The results page looks like the following image. It gives you a summary of the overall modularity and the number of communities found in your network. To make more visual the results, a color can be assigned to the top communities. Just click the Apply button and the communities will be colored.
Also, the communities results are available as node attributes. To view them, go to Attributes> Edit Node Attributes to view them. To download the results, go to File >Export > Node Attributes. The file will contain several columns and among them, the column 'Community' indicating the community identifier.

Try with the example file: example comm.
###Topological study
This tool allows you to calculate basic network topological parameters such as the connection degree, betweenness centrality and clustering coefficient. These parameters are informative of the possible role of the node within the network.
The functional interpretation of genomic data is usually performed by studying the enrichment of any type of biologically relevant annotation in the genes or proteins selected by the experiment with respect to the corresponding distribution of the annotation in the background, typically the rest of genes or proteins in the genome.
Single enrichment analysis is less sensitive than gene set analysis and it is reccommended only in situations in which the genes are selected in the experiment in a categorical way (for example, because they are present in amplified or deleted regions or they are targets of regulatory factors, etc.). In many cases this selection of genes is performed by multiple individual, gene-wise tests. This testing strategy is quite conservative and produces, at the end, a loss of testing power in the whole procedure because a large number of false negatives are sacrificed in order to preserve a low ratio of false positives.
The GO Enrichment method (Al-Shahrour et al., 2004) was the first proposal for functional enrichment that took into account the multiple testing problem. GO Enrichment works as follows:
- GO Enrichment takes two lists of genes. Ideally a group of interest and the rest of the genes in the experiment, although any two groups formed in any way, can be tested against each other.
- These two lists are converted into two lists of functional terms using the corresponding gene or protein - term annotation table.
- Then a Fisher's exact test for 2×2 contingency tables is used to check for significant over-representation of functional terms in one of the lists with respect to the other one.
- Multiple testing correction to account for the multiple hypothesis tested (one for each functional term) is applied. GO Enrichment uses the FDR B&H method.
A complete tutorial explaining how to input data and interpret the results form, click here.
- Al-Shahrour, F., Minguez, P., Tárraga, J., Medina, I., Alloza, E., Montaner, D., & Dopazo, J. (2007). FatiGO+: a functional profiling tool for genomic data. Integration of functional annotation, regulatory motifs and interaction data with microarray experiments. Nucleic Acids Research 35 (Web Server issue): W91-96
- Al-Shahrour, F., Díaz-Uriarte, R. & Dopazo, J. (2004). FatiGO: a web tool for finding significant associations of Gene Ontology terms with groups of genes. Bioinformatics 20: 578-580
The Network Enrichment tool (also known as SNOW) extracts and evaluates the cooperative behaviour of lists of proteins/genes in terms of protein-protein interactions. Thus, this tool complements other Babelomics tools as FatiGO, introducing a new dimension in the functional profiling of high-throughput experiments results, this is, protein-protein interaction data.
Network Enrichment performs two different and complementary types of analysis to the list of proteins/genes submitted:
-
Evaluates the role of the list within the interactome. Network Enrichment study of the topological role of your genes within the protein interactome. It evaluates the global degree of connections, centrality and clustering by comparing the distributions of nodes of the list versus the complete distribution of these parameters among the interactome. The topological parameters calculated here account for different biological properties. For example, essential genes tend to code for proteins with high betweenness centrality, connection degree but low clustering coefficient, however, genes coding for protein complexes show high clustering coefficient but lower betweenness centrality.
-
Evaluates the list’s cooperative behaviour as a functional module. Network Enrichment calculates the MCN, the minimum network that connects the proteins/genes in the list using or without using an external nodes (a non-listed protein) to connect nodes in the list. The topology of this network is evaluated by comparing distributions of node parameters of this MCN against a set of random MCNs with same size range. This approach is similar to other’s tools for functional enrichment analysis such as GO Enrichment with the difference of not having pre-annotated functional modules to evaluate, instead Network Enrichment build it using the protein interactome.
A complete tutorial explaining how to input data and interpret the results form, click here.
- Minguez P, Götz S, Montaner D, Al-Shahrour F, Dopazo J. (2009). SNOW, a web-based tool for the statistical analysis of protein-protein interaction networks. Nucleic Acids Res. 37(Web Server issue):W109-14. - pdf - PubMed
You have obtained a ranked list of proteins or genes ordered from some particular experiment (e.g. they are the result of a differential expression analysis, from a GWAS, etc). From this list of proteins/genes, you want to use protein-protein interaction data to find out their possible role as a protein complex, as a signalling pathway, etc. Gene Set Network Enrichment tool (also known as Network Miner) looks for significant subnetworks of protein-protein interactions within a list of ranked genes/proteins to find out their possible role as a protein complex, as a signalling pathway, etc.
The program also offers the option of defining seed genes. These seed genes are genes known to be associated with the phenotype of interest and therefore you may be interested in including them in your analysis and see the strength of association of the genes in your ranked list with these seed genes.
A complete tutorial explaining how to input data and interpret the results form, click here.
- García-Alonso L, Alonso R, Vidal E, Amadoz A, de María A, Minguez P, Medina I, Dopazo J. (2012). Discovering the hidden sub-network component in a ranked list of genes or proteins derived from genomic experiments. Nucleic Acids Res. 1;40(20):e158. - Pubmed - NAR - Google Scholar