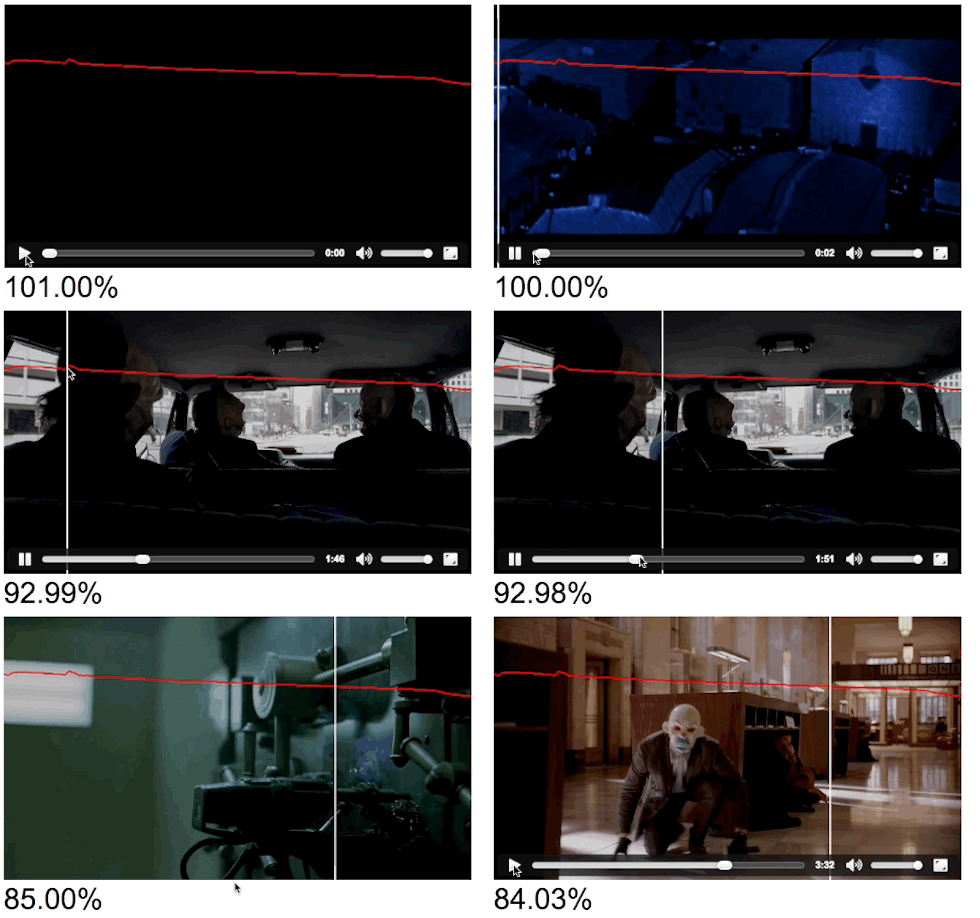
Video Analytics Display is a project to enable a viewer to see the audience retention graph on top of their video. In essence, it'll help you visualize activity better.
YouTube's API allows users to retrieve 100 data points for their audience retention panel. I decided to create a near-replica of YouTube's audience retention graph to make life easy for myself and others, and also, visualizations are easier with HTML5.
So, to make this possible, you need a few things:
- jQuery is required
- Smooth.js is required
Those two files are in the repository.
In your HTML code, you need two items:
- The container that holds your video and graph (default id is 'v-analytics'). For example:
<div id="v-analytics"></div>- The place where you want to display data pints (default id is 'percent'). For example:
<div id="percent"></div>Best to place this in the bottom of your page
analytics = new vAnalytics({

    'id': "v-analytics", // Container ID
    'video_url': "/youtube/darkknight.mp4", // URL of the video on your page
    'width': 640, // Width of video
    'height': 360, // Width of video
    'graphColor': "red", // Color of the graph
    'sliderColor': "white", // Color of the scrubber, line, slider, etc.
    'sliderWidth': 2, // Width of both the graph and slider
    'bgColor': "rgba(0,0,0,0.1)", // Background color overlay on the video
    'data_input': [], // Your data - must be an array
    'video_control': true, // Show the player?
    'results_id': "percent", // Where to display results
  }