-
-
Notifications
You must be signed in to change notification settings - Fork 88
Vue v3 Chartjs (no build)
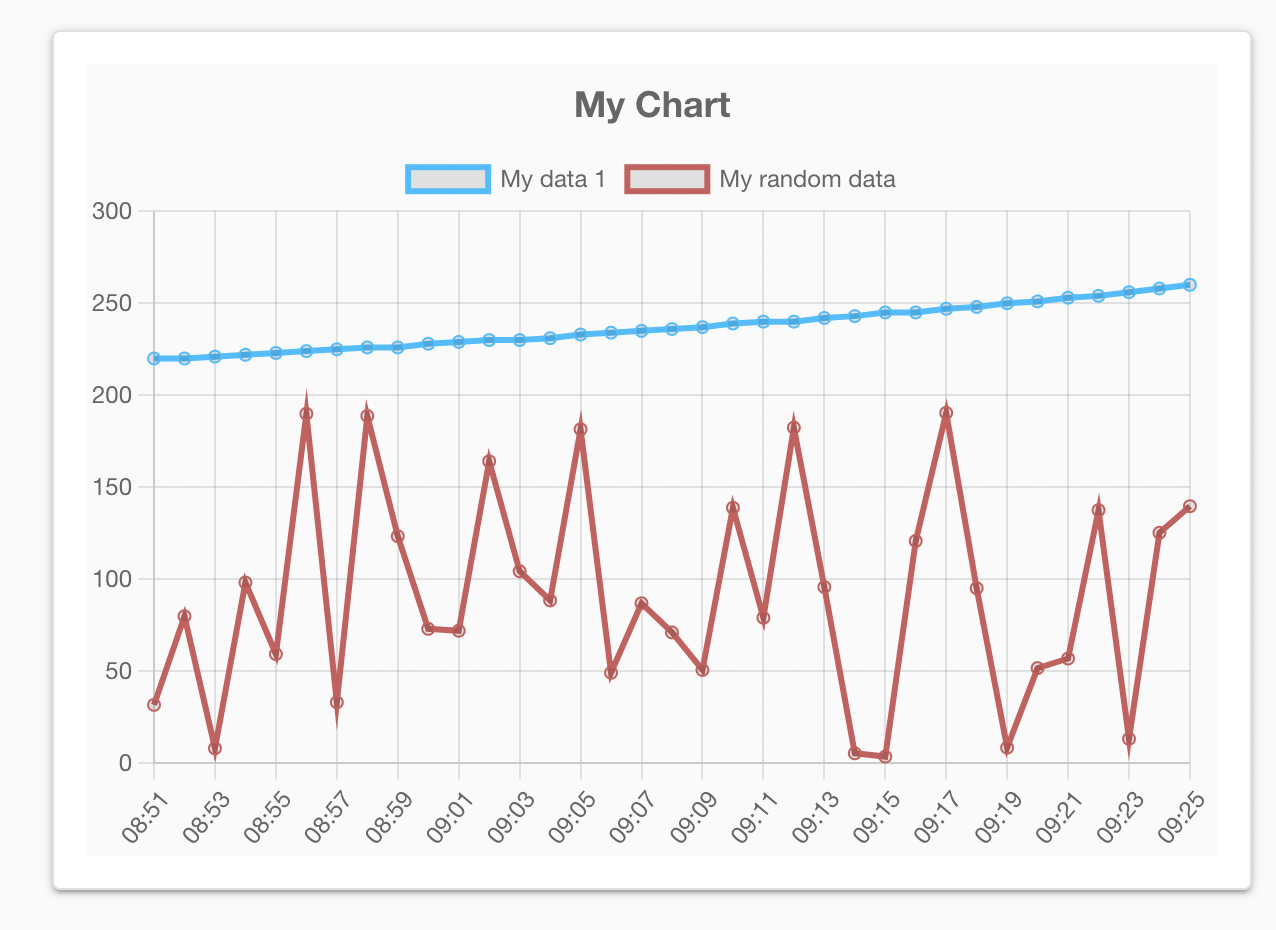
This is an example of using Chartjs with Node-Red, uibuilder, Vue v3. The example is using Quasar, but it is not mandatory.
Note that it uses the IIFE version of the uibuilder front-end library from uibuilder v5.1.1+.
The function loadChartData() shows how to correctly feed data into the chart, while updateChartData() provides to update it when a new data arrives.
<!doctype html>
<html lang="en">

<head>

    <meta charset="utf-8">
    <meta name="viewport" content="width=device-width, initial-scale=1">

    <title>Chartjs example - Node-RED uibuilder</title>
    <meta name="description" content="Node-RED uibuilder - Chartjs">
    <link rel="icon" href="./images/node-blue.ico">

    <link href="https://cdn.jsdelivr.net/npm/quasar@latest/dist/quasar.prod.css" rel="stylesheet" type="text/css">

</head>

<body class="uib bg-grey-1">

    <div id="my-app" class="q-ma-md" style="min-height: 100vh;">
        <div class="q-pa-md q-gutter-md row items-start justify-center">
            <q-card bordered style="width:100%; max-width:600px">
                <q-card-section>
                    <canvas id="uibChart" height="350" width="500" class="bg-grey-1"></canvas>
                </q-card-section>
            </q-card>
        </div>
    </div>


    <!-- #region Supporting Scripts. These MUST be in the right order. Note no leading / -->
    <script src="https://cdn.jsdelivr.net/npm/vue@latest/dist/vue.global.prod.js"></script>
    <script src="https://cdn.jsdelivr.net/npm/quasar@latest/dist/quasar.umd.prod.js"></script>
    <script src="https://cdn.jsdelivr.net/npm/chart.js@^3"></script>
    <script src="../uibuilder/uibuilder.iife.min.js">/* REQUIRED. NB: socket.io not needed */</script>
    <script src="./index.js">/* OPTIONAL: Put your custom code here */</script>
    <!-- #endregion -->

</body>

</html>/* eslint-disable strict */
/* jshint browser: true, esversion: 6, asi: true */
/* globals uibuilder */
// @ts-nocheck
'use strict'
const { createApp, ref } = Vue
Quasar.lang.set(Quasar.lang.enGB)
const configLine = {
type: 'line',
labels: [],
data: {
datasets: [{
label: "My data 1",
data: [],
borderColor: "deepskyblue"
},
{
label: "My random data",
data: [],
borderColor: "indianred"
}]
},
options: {
scales: {
x: {
grid: {
drawBorder: true,
},
}
},
plugins: {
title: {
font: {
size: 18
},
display: true,
text: "My Chart"
},
}
}
};
const myChartData = [{ "x": "08:51", "y": 220 }, { "x": "08:52", "y": 220 }, { "x": "08:53", "y": 221 }, { "x": "08:54", "y": 222 }, { "x": "08:55", "y": 223 }, { "x": "08:56", "y": 224 }, { "x": "08:57", "y": 225 },
{ "x": "08:58", "y": 226 }, { "x": "08:59", "y": 226 }, { "x": "09:00", "y": 228 }, { "x": "09:01", "y": 229 }, { "x": "09:02", "y": 230 }, { "x": "09:03", "y": 230 }, { "x": "09:04", "y": 231 },
{ "x": "09:05", "y": 233 }, { "x": "09:06", "y": 234 }, { "x": "09:07", "y": 235 }, { "x": "09:08", "y": 236 }, { "x": "09:09", "y": 237 }, { "x": "09:10", "y": 239 }, { "x": "09:11", "y": 240 },
{ "x": "09:12", "y": 240 }, { "x": "09:13", "y": 242 }, { "x": "09:14", "y": 243 }, { "x": "09:15", "y": 245 }, { "x": "09:16", "y": 245 }, { "x": "09:17", "y": 247 }, { "x": "09:18", "y": 248 },
{ "x": "09:19", "y": 250 }, { "x": "09:20", "y": 251 }, { "x": "09:21", "y": 253 }, { "x": "09:22", "y": 254 }, { "x": "09:23", "y": 256 }, { "x": "09:24", "y": 258 }, { "x": "09:25", "y": 260 }];
const app = Vue.createApp({
data() {
return {
}
}, // --- End of data --- //
methods: {
loadChartData: function (data) {
data.forEach(element => {
historyChartjs.data.labels.push(element.x)
historyChartjs.data.datasets[0].data.push(element.y)
/* a random dataset */
historyChartjs.data.datasets[1].data.push(Math.random() * 201)
})
historyChartjs.update()
},
updateChartData: function (obj) {
historyChartjs.data.labels.push(obj.x);
historyChartjs.data.datasets[0].data.push(obj.y)
/* random dataset */
historyChartjs.data.datasets[1].data.push(Math.random() * 201)
historyChartjs.update();
},
},
mounted: function () {
uibuilder.onChange('msg', (msg) => {
if (msg.topic === 'chart/newdata') { this.updateChartData(msg.payload) } //a new chart value has arrived. Update it
})
window.historyChartjs = new Chart(document.getElementById("uibChart"), configLine);
this.loadChartData(myChartData);
document.addEventListener('uibuilder:socket:disconnected', function (evt) {
console.log('>> EVENT uibuilder:socket:disconnected >>', evt.detail)
})
document.addEventListener('uibuilder:socket:connected', function (evt) {
console.log('>> EVENT uibuilder:socket:connected >>', evt.detail)
})
}
})
app.use(Quasar, { config: {} })
app.mount('#my-app')
Please feel free to add comments to the page (clearly mark with your initials & please add a commit msg so we know what has changed). You can contact me in the Discourse forum, or raise an issue here in GitHub! I will make sure all comments & suggestions are represented here.
-
Walkthrough 🔗 Getting started
-
In Progress and To Do 🔗 What's coming up for uibuilder?
-
Awesome uibuilder Examples, tutorials, templates and references.
-
How To
- How to send data when a client connects or reloads the page
- Send messages to a specific client
- Cache & Replay Messages
- Cache without a helper node
- Use webpack to optimise front-end libraries and code
- How to contribute & coding standards
- How to use NGINX as a proxy for Node-RED
- How to manage packages manually
- How to upload a file from the browser to Node-RED
-
Vanilla HTML/JavaScript examples
-
VueJS general hints, tips and examples
- Load Vue (v2 or v3) components without a build step (modern browsers only)
- How to use webpack with VueJS (or other frameworks)
- Awesome VueJS - Tips, info & libraries for working with Vue
- Components that work
-
VueJS v3 hints, tips and examples
-
VueJS v2 hints, tips and examples
- Dynamically load .vue files without a build step (Vue v2)
- Really Simple Example (Quote of the Day)
- Example charts using Chartkick, Chart.js, Google
- Example Gauge using vue-svg-gauge
- Example charts using ApexCharts
- Example chart using Vue-ECharts
- Example: debug messages using uibuilder & Vue
- Example: knob/gauge widget for uibuilder & Vue
- Example: Embedded video player using VideoJS
- Simple Button Acknowledgement Example Thanks to ringmybell
- Using Vue-Router without a build step Thanks to AFelix
- Vue Canvas Knob Component Thanks to Klaus Zerbe
-
Examples for other frameworks (check version before trying)
- Basic jQuery example - Updated for uibuilder v6.1
- ReactJS with no build - updated for uibuilder v5/6
-
Examples for other frameworks (may not work, out-of-date)
-
Outdated Pages (Historic only)
- v1 Examples (these need updating to uibuilder v2/v3/v4/v5)