Hola Amigo🖐Here, are some of my Data Science Prediction models clustered together ! Do check it out 🙏
NumPy stands for Numerical Python.
Well,I am upto resolve your queries rightaway!Come,on Let's do it 👍 NumPy is a Python library used for working with arrays. It also has functions for working in domain of linear algebra, fourier transform, and matrices. NumPy was created in 2005 by Travis Oliphant. It is an open source project and you can use it freely. Why Use NumPy? In Python we have lists that serve the purpose of arrays, but they are slow to process. NumPy aims to provide an array object that is up to 50x faster than traditional Python lists. The array object in NumPy is called ndarray, it provides a lot of supporting functions that make working with ndarray very easy. Arrays are very frequently used in data science, where speed and resources are very important. Why is NumPy Faster Than Lists? NumPy arrays are stored at one continuous place in memory unlike lists, so processes can access and manipulate them very efficiently. This behavior is called locality of reference in computer science. This is the main reason why NumPy is faster than lists. Also it is optimized to work with latest CPU architectures. Which Language is NumPy written in? NumPy is a Python library and is written partially in Python, but most of the parts that require fast computation are written in C or C++.
Where is the NumPy Codebase? NumPy source code is located at this github repository https://github.com/numpy/numpy
What is Pandas? Pandas is a Python library used for working with data sets. It has functions for analyzing, cleaning, exploring, and manipulating data. The name "Pandas" has a reference to both "Panel Data", and "Python Data Analysis" and was created by Wes McKinney in 2008.
Why Use Pandas? Pandas allows us to analyze big data and make conclusions based on statistical theories. Pandas can clean messy data sets, and make them readable and relevant. Relevant data is very important in data science.
KNN is basically Supervised machine learning for regression and classification . Still Confused 💁♀️ ?
In data science K-Nearest Neighbors aka KNN is used to classify a data point based on how it's neighbors are classified.
Talking about it's working then let me tell you What it does is it simply learns from data sets and classifies new data points based on similarity or so called Nearest Neighbors.
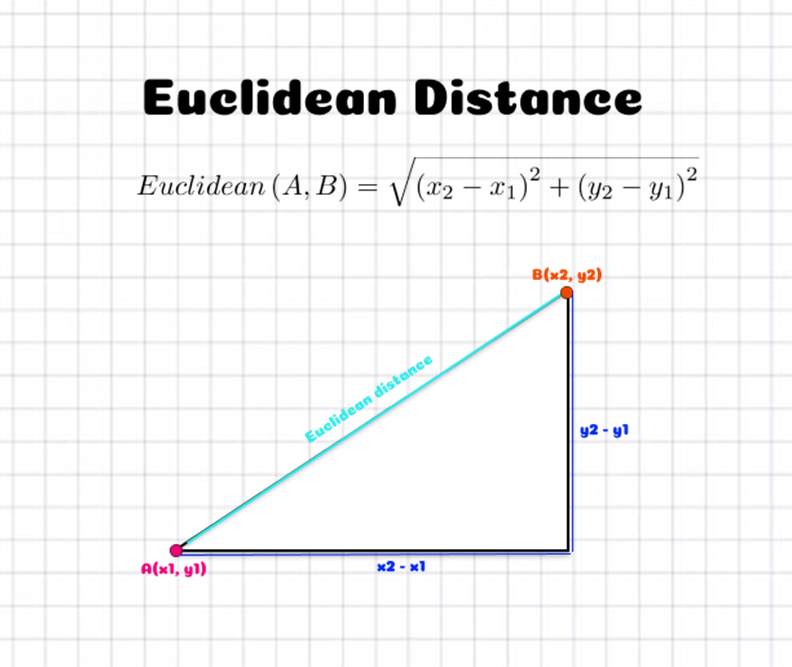
To identify the nearest neighbors, KNN claculates the Euclidean Distance(the Euclidean distance between two points in Euclidean space is the length of a line segment between the two points. It can be calculated from the Cartesian coordinates of the points using the Pythagorean theorem, therefore occasionally being called the Pythagorean distance.)
How do you calculate Euclidean distance?
The Euclidean distance formula is used to find the distance between two points on a plane. This formula says the distance between two points (x1,y1) and (x2,y2) is d = √[(x2 – x1)^2 + (y2 – y1)^2].
For Example, Here x and y are attributes in datasets.So, maximum two attributes could be distance and higher dimensions . In graph we compare 3 types of flowers(setosa,versicolour,virginica). We can actually put the datapoint here and specify no. of neighbors we want to check against .Assume if k=5 we need to look for 5 nearest neighbors nearest to datapoint and check the maximum nearest flower neighbor characteristics satisfied.
👉 Choosing right K is known as 'Parameter Tuning'.
👉 To avoid confusion Odd Value of K is selected foremost.

For Supervised Learning(Classification and Regression) with Labelled Dataset.
KNN can be used for small dataset because -> Computation of Euclidean distance is slow for large data set with a lot of variables.
It's Slow trainee -> As it doesn't actually learn from the train data set.Instead,it uses for training data itself for the purpose of classification of unknown data.
-> keras datasets module provide a few toy datasets (already-vectorized, in Numpy format) that can be used for debugging a model or creating simple code examples. If you are looking for larger & more useful ready-to-use datasets, take a look at TensorFlow Datasets also.
The black and white images from NIST were normalized to fit into a 28x28 pixel bounding box and anti-aliased, which introduced grayscale levels. The MNIST database contains 60,000 training images and 10,000 testing images. The MNIST database (Modified National Institute of Standards and Technology database) is a large database of handwritten digits that is commonly used for training various image processing systems. The database is also widely used for training and testing in the field of machine learning.It was created by "re-mixing" the samples from NIST's original datasets.
The MNIST database contains 60,000 training images and 10,000 testing images.Half of the training set and half of the test set were taken from NIST's training dataset, while the other half of the training set and the other half of the test set were taken from NIST's testing dataset.
By Predicting the heart attack using dataset :-
This database contains 76 attributes, but all published experiments refer to using a subset of 14 of them. In particular, the Cleveland database is the only one that has been used by ML researchers to this date.The "target" field refers to the presence of heart disease in the patient. It is integer valued 0 = no/less chance of heart attack and 1 = more chance of heart attack.
To know more about Health care: Heart attack possibility dataset click this link :- https://archive.ics.uci.edu/ml/datasets/Heart+Disease
By predicting various features of the Flower like Sepal length and width ,petal length and petal width of the 3 different flowers (Setosa,Virginica,Versicolor) .
This particular ML Project is usually referred to as the "Hello World" of Machine Learning.The IRIS flowers dataset contains numeric attributes, and it is perfect for beginners to learn about supervised ML algorithms,mainly how to load and handle data.Also,since this is a small dataset, it can easily fit in memory without requiring special transformations or scaling capabilities.
To know more about IRIS Dataset : Please checkout this link :- http://archive.ics.uci.edu/ml/datasets/Iris
Dataset used to build this stock price prediction model, is the NSE TATA GLOBAL dataset. This is a dataset of Tata Beverages from Tata Global Beverages Limited, National Stock Exchange of India: https://raw.githubusercontent.com/mwitiderrick/stockprice/master/NSE-TATAGLOBAL.csv
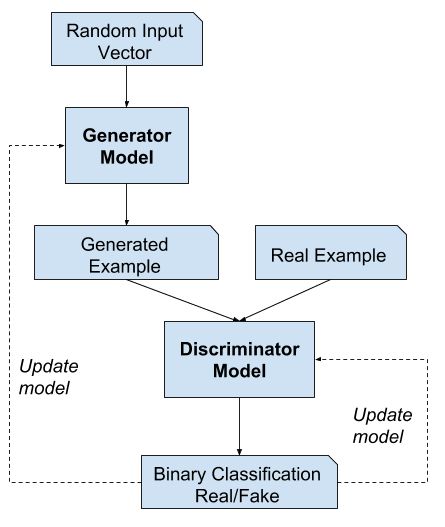
What is a generative adversarial network ?
-> A generative adversarial network (GAN) is a type of construct in neural network technology that offers a wide range of applications in the world of artificial intelligence. Generative Adversarial Networks, or GANs, are a deep-learning-based generative model. More generally, GANs are a model architecture for training a generative model, and it is most common to use deep learning models in this architecture.
I have imported dataset from tf.keras.datasets.fashion_mnist as it was predefined into the keras library.
It gradually Loads the Fashion-MNIST dataset.
This is a dataset of 60,000 28x28 grayscale images of 10 fashion categories, along with a test set of 10,000 images. This dataset can be used as a drop-in replacement for MNIST.
The classes are:
Label Description 0 T-shirt/top 1 Trouser 2 Pullover 3 Dress 4 Coat 5 Sandal 6 Shirt 7 Sneaker 8 Bag 9 Ankle boot
To know more about the api references and built-in smalldatasets visit this -> https://keras.io/api/datasets/fashion_mnist/
This model is a Keras Applications of deep learning models that are made available alongside pre-trained weights. These models can be used for prediction, feature extraction, and fine-tuning.
Weights are downloaded automatically when instantiating a model. They are stored at ~/.keras/models/. The list of classes in this model are ['airplane', 'automobile', 'bird', 'cat', 'deer', 'dog', 'frog', 'horse', 'ship', 'truck'].
Upon instantiation, the models will be built according to the image data format set in your Keras configuration file at ~/.keras/keras.json. For instance, if you have set image_data_format=channels_last, then any model loaded from this repository will get built according to the TensorFlow data format convention, "Height-Width-Depth".
To know more about the api references and predefined model visit -> https://keras.io/api/applications/vgg/#vgg19-function
We will read the image in RBG format and then convert it to a grayscale image. This will turn an image into a classic black and white photo. Then the next thing to do is invert the grayscale image also called negative image, this will be our inverted grayscale image. Inversion can be used to enhance details. Then we can finally create the pencil sketch by mixing the grayscale image with the inverted blurry image. This can be done by dividing the grayscale image by the inverted blurry image. Since images are just arrays, we can easily do this programmatically using the divide function from the cv2 library in Python.
The image I have used in this project is this https://static.independent.co.uk/s3fs-public/thumbnails/image/2016/09/02/11/mother-teresa-3.jpg?width=1200
Basically, it's absolutely beginner-friendly project that can be made using OpenCV,Python and Matplotlib library for visualizations of the image transformation.


