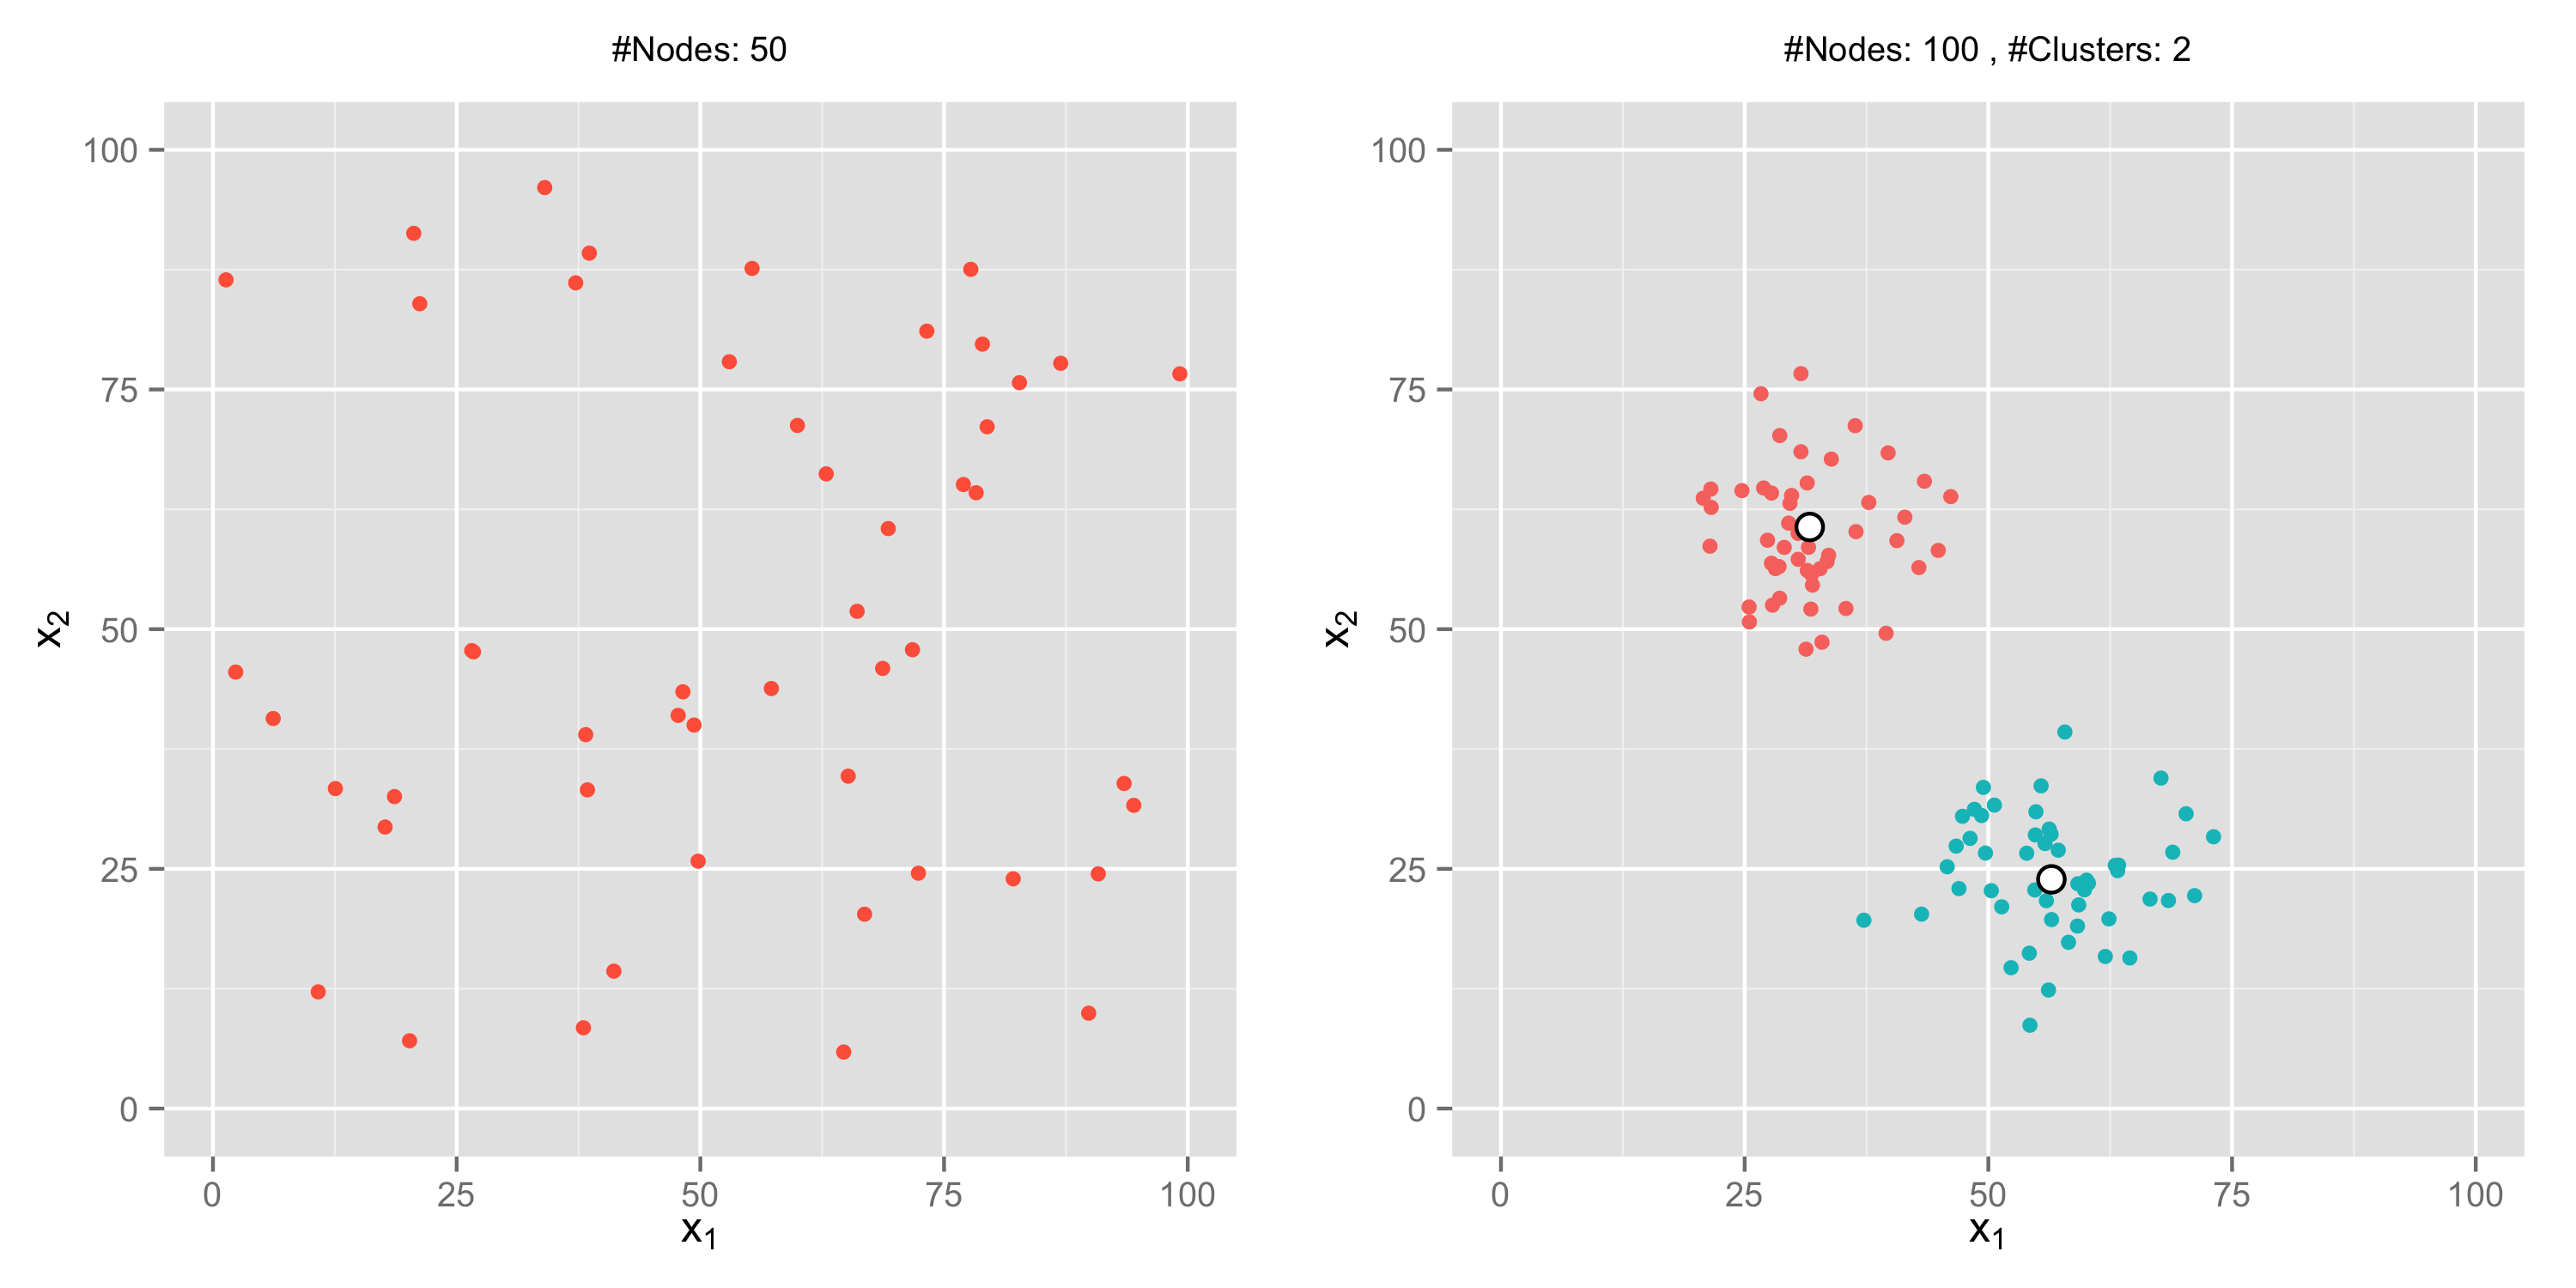
The netgen package offers several methods to generate random graphs respectively
networks for benchmarking purposes. You may want to generate some random graphs
or clustered graphs to perform benchmark studies on some fine algorithms for
the travelling salesperson problem as an example. Examples of generated networks
are depicted in the following figure.

The package has recently been submitted to CRAN. Find additional information on the official CRAN website. To install the current developement version of the package, install the devtools package by Hadley Wickham, load it and type the following line to a R session:
install_github("jakobbossek/netgen")To generate a random network in the euclidean plane [0,1] x [0,1] we simply
load the package and call the generateRandomNetwork function, providing the
desired number of nodes.
library(netgen)
set.seed(123)
x = generateRandomNetwork(n.points = 50L)
print(x)
autoplot(x)
To generate a network with points distributed around several clusters in the
[0,100] x [0, 100] space make use of the more powerful generateClusteredNetwork
function. It is mandatory to provide the number of points n.points and the number of clusters n.cluster.
Note: See the documentation of the function to read about how it works internally.
library(netgen)
set.seed(1)
x = generateClusteredNetwork(n.cluster = 5L, n.points = 150L, upper = 100)
print(x)
autoplot(x)Please address questions and missing features about the netgen package to the author Jakob Bossek [email protected]. Found some nasty bugs? Please use the issue tracker for this. Pay attention to explain the problem as good as possible. At its best you provide an example, so I can reproduce your problem.