#Tutorial
This is a tutorial on how to use the ITIM code for the intrinsic analysis of macroscopically planar interfaces. In this tutorial you will learn how to:
- compute intrinsic profiles at planar liquid interfaces
- compute the non-intrinsic and intrinsic profiles of different layers below the interfacial one
- use the
occupancyandtemperaturefields in the PDB output files for visualization and analysis - understand the difference between atomic and molecular layers
##Water / Carbon Tetrachloride
In the examples/ccl4/ directory of your build directory, there are all the necessary files to run simple test on a single frame from a H2O/CCl4 snapshot. You can test them all by launching the RUN.sh script (remember, from the build directory, not from the source one!)
If everything goes fine, you should see something like:
 > ./RUN.sh
 g_density needs a .tpr file, let's create it now....
 Using ../../g_itim ...
 Intrinsic mass density profile w.r.t. water -> dens_H2O_atomic_m.xvg
 Intrinsic mass density profile w.r.t. ccl4-> dens_CCl4_atomic_m.xvg
 Intrinsic number density profile w.r.t. water + layer config -> dens_H2O_atomic_n.xvg, layers_dens_H2O_atomic_n.pdb
 Intrinsic number density profile w.r.t. water with Monte Carlo normalization -> dens_H2O_atomic_MC_n.xvg
 Intrinsic number density profile of the molecular COM, w.r.t. water -> dens_H2O_COM_n.xvg
 Intrinsic number density profile w.r.t. water + layer config -> dens_H2O_molecular_n.xvg, layers_dens_H2O_molecular_n.pdb
 Intrinsic molecular mass density profile w.r.t. water with Monte Carlo normalization-> dens_H2O_molecular_n.xvg
This is only a test to check that nothing went wrong with your installation, and provides you with some examples (look into RUN.sh) on how to invoke the program.
The profiles one can obtain from this single snapshot are already enough to get the picture, but it is advisable to produce a trajectory. The grompp.mdp file is already set upto produce 1000 frames. If you already ran the ./RUN.sh script, a binary topology, ccl4-h2o.tpr should have been produced. You can just create the trajectory by running mdrun (assuming you use GROMACS v5.x)
> gmx mdrun
Once GROMACS is done, you should see a file name traj.trr, containing 1000 trajectory snapshots.
##The first intrinsic profile To have a basic idea of what an intrinsic profile is, have a look at this short introduction As a first example, we are going to compute the intrinsic profile of water and CCl4, with respect to the water phase. The program needs to be supplied with at least one analysis group. The first group supplied is going to be the one used to define the interface. The following 1 or 2 groups are those that will be used to compute the density profiles, in our case, water and CCl4.
The present system uses the TIP4P water model, which uses one virtual site. Since this site should not be considered neither for the determination of the interface, nor for the calculation of the density profiles, we will use the group [H2O] defined in the index.ndx file (created in this case by the RUN.sh script). The program should thus be invoked in the following way:
> echo "H2O H2O CCl4" | g_itim -ng 3 -s ccl4-h2o.tpr -f traj.trr -n index.ndx \
			-dens mass -alpha 0.2 -center -sl 200 -o profile.xvg
Here we assume that g_itim has been copied to one of the directories present in your $PATH enviroenment. Otherwise, you might invoke it using its absolute path. Note that you might also need to tell g_itim where the GROMACS topology files are, using something like
> export GMXLIB=~/gromacs-5.0.6/share/top
before invoking the program as above.
We are passing the names of the three groups to the g_itim program, using the following flags, which are common to other GROMACS analysis tools:
-ng 3           ->  expect 3 groups to be supplied
-s ccl4-h2o.tpr ->  fetch information on the topology of molecules from this file
-f traj.trr     ->  fetch coordinates from this file
-n index.ndx    ->  nonstandard groups (like H2O) are defined here
-o profile.xvg  ->  the output file
In addition, there is a set of flags, which are specific for g_itim, namely:
-alpha 0.2      ->  radius of the probe sphere (in nm)
-dens mass      ->  calculate a mass density profile
-center         ->  center the profile
-sl 200         ->  calculate the profile using 200 bins
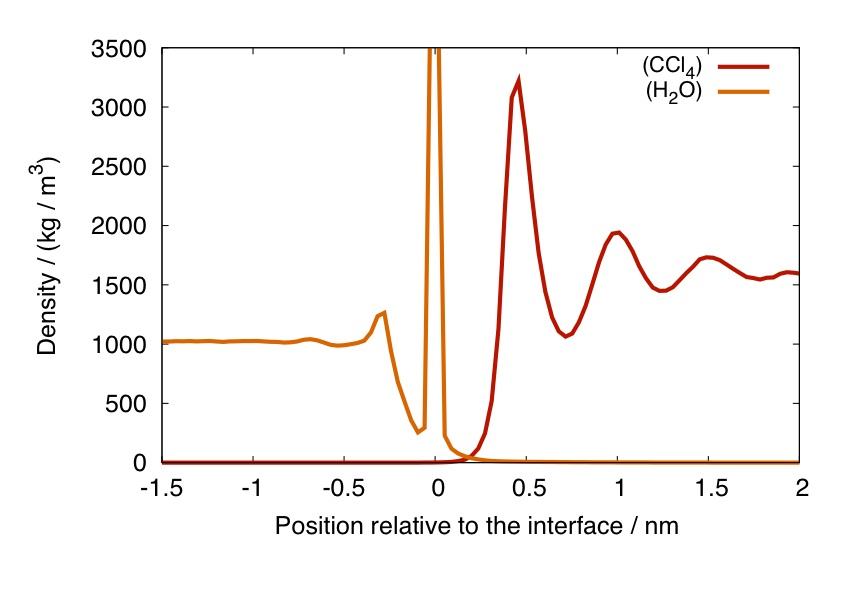
The result should be something similar to this:
But first you need to understand the structure of the output file (BTW, you can check the Intrinsic Profiles in-a-nutshell page for a short discussion on the meaning of this profile).
##Dissecting the output file
The output ofile is compatible in format with xmgrace and gnuplot, although it does not use any particular features, besides comments.
The first ten lines of the file produce by the previous analysis should look like this:
#column 1 : position
#column 2 : support group (H2O) nonintr. atomic dens. layer 1
#column 3 : support group (H2O) intrins. atomic dens. layer 1
#column 4 : group 1 (H2O)  nonintr. dens. atomic
#column 5 : group 1 (H2O)  intrins. dens. atomic
#column 6 : group 2 (CCl4)  nonintr. dens. atomic
#column 7 : group 2 (CCl4)  intrins. dens. atomic
-5.570740  0.000000  0.000000  0.000000  0.000000  748.426758  0.000000
-5.515033  0.000000  0.000000  0.000000  0.000000  742.002167  0.000000
-5.459325  0.000000  0.000000  0.000000  0.000000  748.426758  0.000000
Don't worry about the zeroes, this is just the beginning of the file...
The comments are explaining which quantity is reported in which column. Both intrinsic and non-intrinsic profiles are stored in this file.
-
Column 1 ("position") has a slightly different meaning for the two cases: it is the distance from the center of the phase used to determine the surface ("support phase") in the non-intrinsic case, and the distance from the interface in the intrinsic case.
-
Column 2 contains the non-intrinsic density profile of the atoms belonging to the surface layer (layer 1 of the support group)
-
Column 3 contains the intrinsic density profile of the atoms in the surface layer. This is a trivial Dirac-delta contribution.
-
Columns 4 & 6 contain the non-intrinsic profiles of water and CCl4. These are the usual profiles that one would calculate with tools such as GROMACS's
g_density -
Columns 5 & 7 contain the intrinsic profiles of water and CCl4, with respect to the water phase.
The figure of the profiles presented above can be then obtained by plotting columns 5 & 7 versus column 1. If you are a gnuplot user, you can do this by:
gnuplot> plot 'profile.xvg' using 1:5 with lines , '' using 1:7 with lines
or, in short
gnuplot> p'profile.xvg' u 1:5 w l,'' u 1:7 w l
Comment lines are automatically skipped. As an excercise, plot the non-intrinsic distribution of the first water layer on top of the total non-intrinsic water density profile.
##Visualizing surface atoms
To obtain the coordinates of the interfacial atoms, you should re-run the analysis code with the -dump flag. The -dumpphase flag will be also useful to visualize the rest of the system. In order not to create a large trajectory of .pdb or .gro files, let's limit ourselves to analyzing the first frame:
> echo "H2O H2O CCl4" | ../../g_itim -b 0 -e 0 -ng 3 -s ccl4-h2o.tpr -f traj.trr -n index.ndx \
			-dens mass -alpha 0.2 -center -sl 200 -o profile.xvg -dump -dumpphase
The files that will be created are the following
-dump       ->  layers.pdb           : contains the position of various atomic/molecular layers,including the intrinsic distance of atoms from the surface
-dumpphase  ->  phase.gro phase2.gro : contain the position of the atoms of the 2 groups used for analysis (here, H2O and CCl4)
Note that phase.gro and phase2.gro will be different from the initial .gro configuration file, as the system has been centered (and possibly, also rotated)
It is possible now to use tools such as vmd to visualize our results.
We can load both files simultaneously in vmd by invoking it as:
vmd -m layers.pdb phase2.gro
(the atoms of phase.gro will coincide with those of layers.pdb, but without information on atomic layers!)
If you want to draw the simulation box, you should take care of centering it with (from the vmd console):
% pbc box -center origin
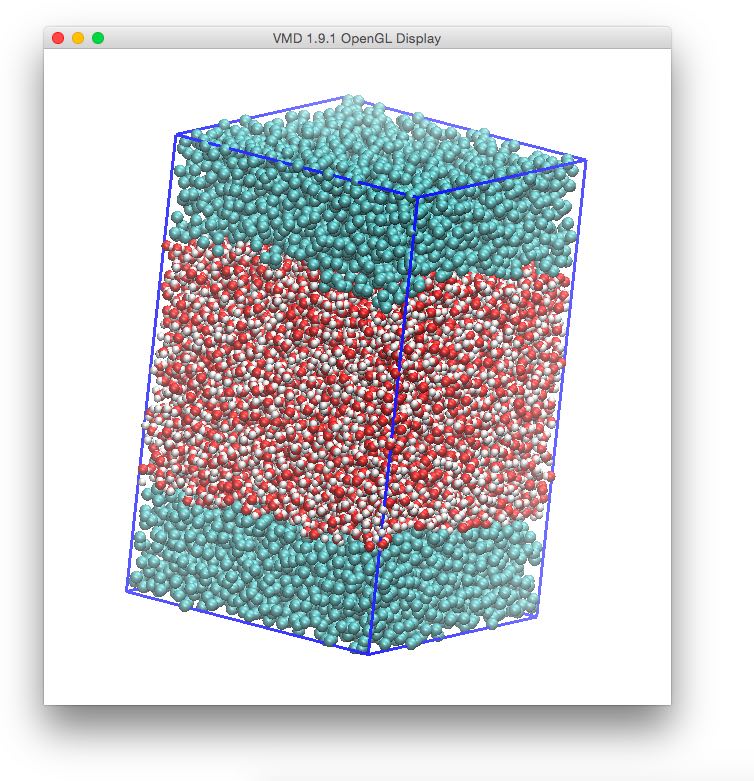
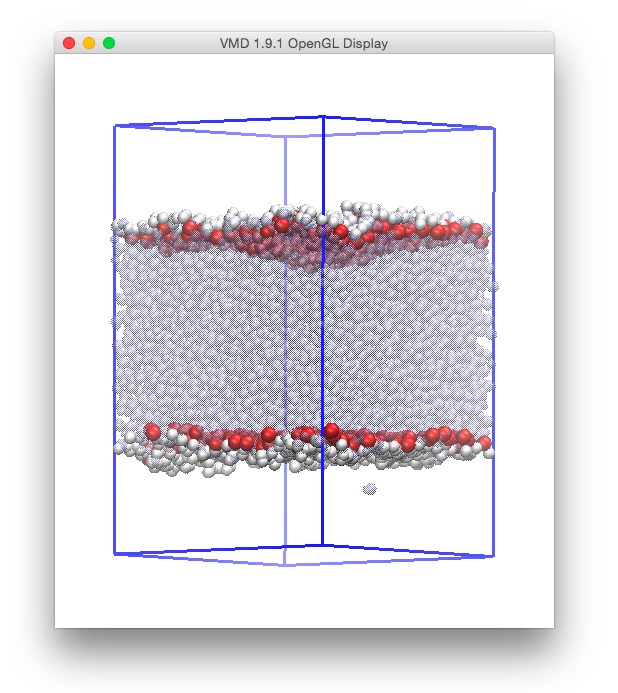
The system will then be looking similar to this, using VdW as a representation:
If you open the layers.pdb files with a text editor, you will notice that also the occupancy and temperature fields are used, for example:
ATOM     37   OW SOL   10     -26.251 -28.771 -22.025  0.00 -6.62             2
ATOM     38  HW1 SOL   10     -25.536 -28.854 -21.394  0.00 -7.37             2
ATOM     39  HW2 SOL   10     -25.908 -28.187 -22.701  0.00 -6.14             2
ATOM     41   OW SOL   11     -32.382  31.249 -25.394  1.00  0.00             2
-
The first column after the atomic position (
occupancy) represent the number of the layer associated with that atom (an integer, although theoccupancyfield is a rational one): if theoccupancyfield is zero, it means that no layer has been associated with that atom. The atoms in the surface layer haveoccupancy=1. -
The column right after the
occupancyone is the so calledtemperatureone, orbeta. In thelayers.pdbfile, this column stores the distance of the atom from the intrinsic surface. As one can easily notice, atoms withoccupancy=1have alwaystemperature=0, as they are located exactly at the surface. The last column takes either the value 1, or 2, depending whether the atom is in the right or left interface (in periodic boundary conditions each phase has always two interfaces...). This information is redundant, as due to centering all atoms on the left of the interface will have an negative intrinsic displacement, and those on the right a positive one.
This file format can be very useful to perform analysis which are not allowed by the g_itim code, by writing code that parses the layers.pdb trajectory and uses the information about layer and intrinsic distance.
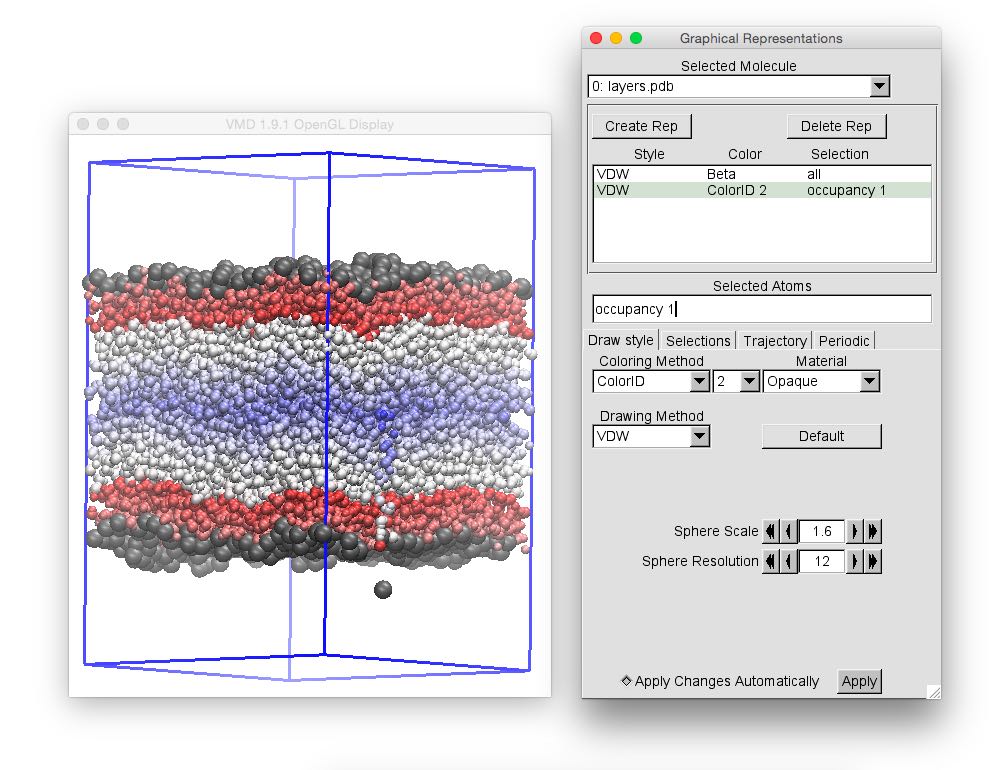
As a next excercise, we are going to mark the surface atoms, and draw all other water atoms with a color that depends on the intrinsic surface. This can be done in vmd by adding a representation, and using occupancy 1 in the Selected atoms field for the surface atoms, that are here drawn using slightly larger VdW radii of gray color, and by selecting Beta as a Coloring method for the other representation (Selected atoms being all in this case).
One can notice the presence of a curious spike of the color ramp on one face of the simulation box. This coincides with the presence of a water molecule detected as a surface one, although clearly out of the main water phase (thus in the CCl4 phase, which is not shown here). This has happened because the simple ITIM algorithm cannot distinguish between water molecules solvated in the opposite phase, or in the gas phase, and all the other molecules in the water-rich phase. In order to solve this problem, we will need, before using ITIM, to filter molecules using a cluster search.
The g_itim program can combine the ITIM analysis with a cutoff-based cluster search, which is used to detect molecules solvated in the other phase, or in vapour phase, and to exclude them from the ITIM analysis. The basic idea is that (as long as one is far from critical points) it is meaningful to consider the main phase as the largest group of molecules which are all within a given cutoff from another member of the group (that is, the largest cluster). The cluster search can be switched on with the flag
-cluster
In addition to the three groups, three cut-off parameters (in nm) will have to be given, so that the whole command line would look like:
echo "H2O H2O CCl4 .35 .35 .35 " | g_itim -ng 3 -s ccl4-h2o.tpr -f traj.trr -b 0 -e 0 -n index.ndx \
			-dens mass -alpha 0.2 -center -sl 200 -o profile.xvg -dump -dumpphase -cluster
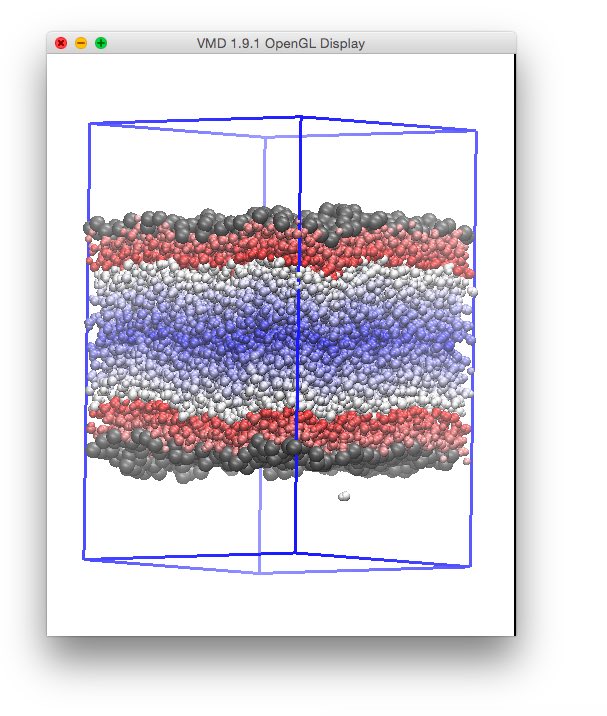
Where we have chosen a cutoff of 0.35 nm for all species, corresponding to the first minimum of the radial distribution function of water Oxygens. This way, the water molecule solvated in the CCl4 phase is not recognized anymore as a surface one, and the distribution of distances does not show anymore the artifact:
##Successive and molecular layers
What we have computed so far did not take into account at all the existance of molecules. For the determination of the surface atoms, in this very case, using molecules rahter than atoms would not make much of a difference. This is because in the TIP4P water model, (as in many others) the Hydrogen atoms are located within the Lennard-Jones radius of the Oxygen atom. The ITIM algorithm checks for contacts between the probe spheres (their radius being determined by the flag -alpha) and atoms of the H2O phase. Since Hydrogens do not have a Lennard-Jones radius, and are inside that of Oxygen, any search would end up with just Oxygen atoms in the interfacial layer. Again, note that this is true only because of the particular structure of the water molecule: for more complex molecules you would see only part of them at the surface (try with CCl4 as a support phase!)
The problem becomes more evident once successive layers are being calculated. Successive layers can be trivially calculated by applying repeatedly the ITIM algorith to the atoms which have not been tagged as surface one. In g_itim it is possible to search for (in principle) an arbitrary large nuber of layers. This is done by supplying the option
-layers <n>
wher is the number of layers that the algorithm will try to identify. Note that this will take roughly times the computational time required to identify only the surface layer. Of course, getting close to the center of the phase, the available atoms will start being not enough to define a whole (inner) surface layer, driving the code to report an error like
Error: all (29238) particles scanned, but did not associate all testlines on the positive side...
This is a sign that one needs to diminish the number of layers to be analyzed.
Let's try to analyze the first 4 layers with the command
echo "H2O H2O CCl4 .35 .35 .35" | g_itim -ng 3 -s ccl4-h2o.tpr -f traj.trr -b 0 -e 0 -n index.ndx \
			-layers 4 -dens mass -alpha 0.2 -center -sl 200 -o profile.xvg -dump -cluster
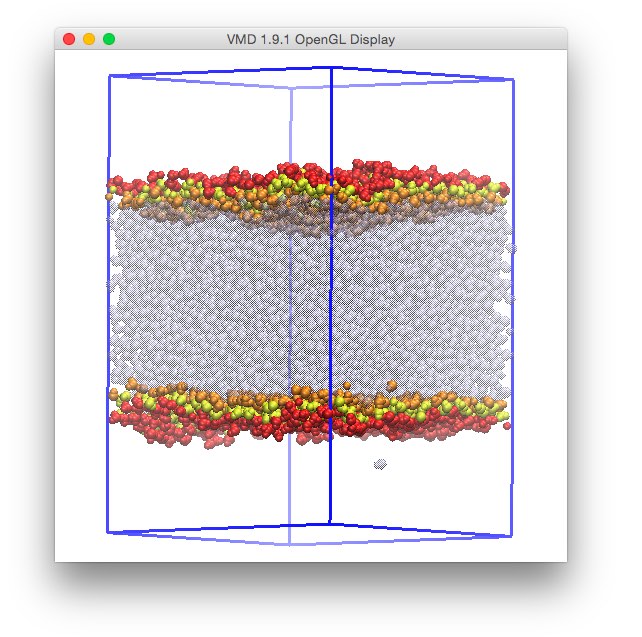
In the following figure, we show just the sencond layer, by choosing occupancy 2 in the Selected Atoms mask, and we show the res (all) as transparent spheres.
On notices immediately that the second layer has an odd composition: Hydrogen atoms in the outer part of the layer, and Oxygen atoms in the inner one. This happens because, once the first layer atoms (Oxygens) are removed, the Hydrogen atoms are exposed to the probe spheres and detected as surface atoms. This if of course completely fine from the point of view of the algorithm, but probably does not reflect the expectations of what the second layer should look like, precisely because we have taken into account, so far, only atoms an not molecules. The molecular-based version of the algorithm can be the switched on using the -mol flag, so that as soon as an atom is detected as surface one, all other atoms in the corresponding molecule are also tagged as surface ones. The command line now reads:
echo "H2O H2O CCl4 .35 .35 .35" | g_itim -ng 3 -s ccl4-h2o.tpr -f traj.trr -b 0 -e 0 -n index.ndx \
			-layers 4 -dens mass -alpha 0.2 -center -sl 200 -o profile.xvg -dump -cluster -mol
and the first three molecular layers looks like this (now coloring Hydrogen and Oxygen atoms using the same color to distinguish the layers):
Notice that, again, for water only, this problem could have been avoided by using only water Oxygens as support group, and the complete water molecules as one of the analysis groups. This, however, is not possible in case of more complex molecules, and for this reason it is possible in g_itim to decide whether to use an atom-based or molecule-based surface (and layers) identification. It is up to the user to decide what fits better to his/her needs.
The options
-MCnorm
-com
-inclusive
-additional
will be discussed in another tutorial.

